

Topics In This Section: Message from the Chief Financial Officer | Report of the Independent Auditors | Department’s Response to the Report of the Independent Auditors | Principal Financial Statements | Notes to the Principal Financial Statements | Required Supplementary Stewardship Information | Required Supplementary Information
REQUIRED SUPPLEMENTARY STEWARDSHIP INFORMATION
Investment in Human Capital (in Millions)
For the Year Ended September 30, 2015
|
Responsibility Segment Program |
2015 |
2014 |
2013 |
2012 |
2011 |
|---|---|---|---|---|---|
|
National Institutes of Health |
|||||
|
Research Training and Career Development |
$1,631 |
$1,541 |
$1,621 |
$1,858 |
$1,920 |
|
Health Resources and Services Administration |
|||||
|
Scholarships Loan Repayments and Loans |
828 |
660 |
766 |
705 |
761 |
|
Other Investments in Human Capital |
|||||
|
Other |
14 |
8 |
6 |
6 |
11 |
|
Totals |
$2,473 |
$2,209 |
$2,393 |
$2,569 |
$2,692 |
Investments in Human Capital are expenses incurred by federal education and training programs for the public, which are intended to maintain or increase national productive capacity. The following OpDivs conduct education and training programs under this category:
National Institutes of Health
The NIH Research Training and Career Development Programs address the need for trained personnel to conduct medical research. The primary goal of the support that NIH provides for graduate training and career development is to produce new, highly trained investigators who are likely to perform research that will benefit the nation’s health. NIH's major research training and career development programs include eight institutional training grants, five individual fellowships, 13 research career development awards, two research education grants, five loan repayment programs, and a variety of other training related programs. The 27 NIH institutes and centers administer NIH's major research training and career development programs. NIH’s ability to maintain the momentum of recent scientific progress and international leadership in medical research depends upon the continued development of new, highly trained investigators.
Health Resources and Services Administration
HRSA's Bureau of Health Workforce (BHW) improves the health of the nation’s underserved communities and vulnerable populations by developing, implementing, evaluating, and refining programs that strengthen the nation’s health care workforce. BHW programs holistically support a diverse, culturally competent workforce by addressing components including: education and training; recruitment and retention; financial support for students, faculty, practitioners, and supporting institutions; data analysis, and evaluation and coordination of global health workforce activities. These efforts support development of a skilled health workforce serving in areas of the nation with the greatest need. In FY 2015, BHW awarded more than $1.0 billion to organizations and individuals. These funds were distributed among BHW’s scholarships, loans, and loan repayment programs, health professions training programs, and programs supporting graduate medical education. Funding also supported the collection and analysis of health workforce data, which inform policies regarding health workforce supply and demand.
Other Investments in Human Capital
Administered by ACL, Projects of National Significance grants are awarded to public and private non-profit institutions to enhance the independence, productivity, integration, and inclusion into the community of people with developmental disabilities. ACL also administers the Administration for Intellectual and Developmental Disabilities program. This program works to ensure that individuals with developmental disabilities and their families are able to fully participate in and contribute to all aspects of community life.
In addition, AHRQ provides an array of pre-doctoral and postdoctoral educational and career development grants and opportunities in health services research training. Research Training and Career Development activities are administered by the Division of Research Education in the Office of Extramural Research, Education, and Priority Populations.
Investment in Research and Development (in Millions)
For the Year Ended September 30, 2015
|
Responsibility Segments |
Basic |
Applied |
Develop-mental |
2015 |
2014 |
2013 |
2012 |
2011 |
Grand Total |
|---|---|---|---|---|---|---|---|---|---|
|
AHRQ |
$- |
$167 |
- |
$167 |
$250 |
$372 |
$401 |
$333 |
$1,523 |
|
CDC |
73 |
391 |
26 |
490 |
394 |
457 |
408 |
457 |
2,206 |
|
FDA |
123 |
- |
6 |
129 |
103 |
94 |
80 |
58 |
464 |
|
NIH |
16,856 |
11,237 |
- |
28,093 |
27,719 |
29,328 |
30,681 |
32,902 |
148,723 |
|
Other |
3 |
23 |
- |
26 |
3 |
1 |
2 |
7 |
39 |
|
Totals |
$17,055 |
$11,818 |
$32 |
$28,905 |
$28,469 |
$30,252 |
$31,572 |
$33,757 |
$152,955 |
The research and development programs in HHS include the following:
Agency for Healthcare Research and Quality
AHRQ is the leading federal agency charged with improving the safety and quality of America's health care system. AHRQ develops knowledge, tools, and data needed to improve the health care system and help Americans, health care professionals, and policymakers make informed health decisions. AHRQ supports health services research that will improve the quality of health care and promote evidence based decision making.
Centers for Disease Control and Prevention
Diseases, Occupational Safety and Health, Health Promotion and Environmental Health and Injury Prevention were the primary areas where CDC's research and development was invested.
Food and Drug Administration
FDA has two programs that meet the requirements of research and development investments: Orphan Products Development (OPD) Program and FDA Research Grants Program. While the FDA’s center components conduct scientific studies, FDA does not consider this type of research as “research and development” because it is used to support FDA’s regulatory policy and decision making processes.

The OPD Program was established by the Orphan Drug Act with the purpose of identifying orphan products and facilitating their development. An orphan product is a drug, biological product, medical device, or medical food that is intended to treat a rare disease or condition (i.e., one with a prevalence of fewer than 200,000 people in the U.S.
The FDA Research Grants Program is a grants program whose purpose is to assist public and non-public institutions and for-profit organizations to establish, expand, and improve research, demonstration, education, and information dissemination activities concerned with a wide variety of FDA areas.
National Institutes of Health
The NIH Research Program includes all aspects of the medical research continuum, including basic and disease-oriented research, observational and population-based research, behavioral research and clinical research, including research to understand both health and disease states, to move laboratory findings into medical applications, to assess new treatments or compare different treatment approaches, and health services research. NIH regards the expeditious transfer of the results of its medical research for further development and commercialization of products of immediate benefit to improved health as an important mandate.
NIH issues yearly research highlights in December each year. The highlights cover Clinical Advances/Breakthroughs, Promising Medical Advances, and Insights from the Lab. In 2014, NIH-funded research resulted in top scientific honors which includes one Nobel laureate in chemistry, and four NIH-funded recipients received awards from the Lasker Foundation. For more information on the yearly highlights, visit www.nih.gov/research-training/nih-research-highlights.
Other Investments in Research and Development
ACF oversees research and development programs that contribute to a better understanding of how to improve the economic and social well-being of families and children, so that they may lead healthier and more productive lives. HRSA conducts health services research that will improve the quality of health care, increase capacity, and promote evidence-based decision making. HRSA's basic research supports the causes, diagnosis, prevention, and cure of Hansen's disease.
REQUIRED SUPPLEMENTARY INFORMATION
Combining Statement of Budgetary Resources (in Millions)
For the Year Ended September 30, 2015
|
|
CMS |
|
||||
|
Budgetary Resources: |
Medicare HI |
Medicare |
Medicaid |
Other Agency Budgetary Accounts[1] |
Agency Combined Budgetary Totals |
Non-Budgetary Credit Reform Financing Account |
|---|---|---|---|---|---|---|
|
Unobligated Balance, Brought Forward, Oct 1 |
$ - |
$ - |
$1,375 |
$36,503 |
$37,878 |
$3 |
|
Recoveries of Prior Year Unpaid Obligations |
13 |
- |
22,148 |
4,219 |
26,380 |
- |
|
Other Changes in Unobligated Balance |
- |
- |
1 |
20,175 |
20,176 |
- |
|
Unobligated Balance from Prior Year Budget Authority, Net |
13 |
- |
23,524 |
60,897 |
84,434 |
3 |
|
Appropriations (Discretionary and Mandatory) |
285,049 |
270,457 |
351,098 |
519,003 |
1,425,607 |
- |
|
Borrowing Authority (Discretionary and Mandatory) |
- |
- |
- |
- |
- |
50 |
|
Spending Authority from Offsetting Collections |
12 |
11,183 |
763 |
20,973 |
32,931 |
80 |
|
Total Budgetary Resources |
285,074 |
281,640 |
375,385 |
600,873 |
1,542,972 |
133 |
|
Status of Budgetary Resources: |
|
|
|
|
||
|
Obligations Incurred |
285,074 |
281,640 |
375,051 |
535,585 |
1,477,350 |
131 |
|
Unobligated Balances, End of Year: |
|
|
|
|
||
|
Apportioned |
- |
- |
205 |
26,244 |
26,449 |
- |
|
Exempt from Apportionment |
- |
- |
- |
(2,621) |
(2,621) |
- |
|
Unapportioned |
- |
- |
129 |
41,665 |
41,794 |
2 |
|
Total Unobligated Balance, End of Year |
- |
- |
334 |
65,288 |
65,622 |
2 |
|
Total Status of Budgetary Resources |
-285,074 |
281,640 |
375,385 |
600,873 |
1,542,972 |
133 |
|
Change in Obligated Balance: |
|
|
|
|
||
|
Unpaid Obligation: |
|
|
|
|
||
|
Unpaid Obligations, Brought Forward, Oct 1 |
29,502 |
22,816 |
35,406 |
128,442 |
216,166 |
998 |
|
Obligation Incurred |
285,074 |
281,640 |
375,051 |
535,585 |
1,477,350 |
131 |
|
Outlays (Gross) |
(281,947) |
(280,975) |
(346,737) |
(521,325) |
(1,430,984) |
(754) |
|
Actual Transfers, unpaid obligations (net) |
- |
- |
- |
196 |
196 |
- |
|
Recoveries of Prior Year Unpaid Obligations |
(13) |
- |
(22,148) |
(4,219) |
(26,380) |
- |
|
Unpaid Obligations, End of Year |
32,616 |
23,481 |
41,572 |
138,679 |
236,348 |
375 |
|
Uncollected Payments: |
|
|
|
|
||
|
Uncollected Customer Payments from Federal Sources, Brought |
- |
- |
- |
(11,838) |
(11,838) |
(430) |
|
Adjustment to Uncollected Payments, Federal Sources |
- |
- |
- |
- |
- |
- |
|
Change in Uncollected Customer Payments from Federal Sources |
- |
(11,172) |
- |
886 |
(10,286) |
270 |
|
Uncollected Payments from Federal Sources, End of Year |
- |
(11,172) |
- |
(10,952) |
(22,124) |
(160) |
|
Memorandum (non-add) Entries: |
|
|
|
|
||
|
Obligated Balance, Start of Year |
29,502 |
22,816 |
35,406 |
116,604 |
204,328 |
568 |
|
Obligated Balance, End of Year |
32,616 |
12,309 |
41,572 |
127,727 |
214,224 |
215 |
|
Budget Authority and Outlays, Net: |
||||||
|
Budget Authority, Gross (Discretionary and Mandatory) |
285,061 |
281,640 |
351,861 |
539,976 |
1,458,538 |
130 |
|
Actual Offsetting Collections (Discretionary and Mandatory) |
(13) |
(10) |
(763) |
(22,474) |
(23,260) |
(350) |
|
Change in Uncollected Customer Payments from Federal Sources |
- |
(11,172) |
- |
886 |
(10,286) |
270 |
|
Budget Authority, Net (Discretionary and Mandatory) |
285,048 |
270,458 |
351,098 |
518,388 |
1,424,992 |
50 |
|
Outlays, Gross (Discretionary and Mandatory) |
281,947 |
280,975 |
346,737 |
521,325 |
1,430,984 |
754 |
|
Actual Offsetting Collections (Discretionary and Mandatory) |
(13) |
(10) |
(763) |
(22,474) |
(23,260) |
(350) |
|
Outlays, Net (Discretionary and Mandatory) |
281,934 |
280,965 |
345,974 |
498,851 |
1,407,724 |
404 |
|
Distributed Offsetting Receipts |
(29,813) |
(349,381) |
- |
(993) |
(380,187) |
- |
|
Agency Outlays, Net (Discretionary and Mandatory) |
$252,121 |
$ (68,416) |
$345,974 |
$497,858 |
$1,027,537 |
$404 |
Summary of Other Agency Budgetary Accounts
| OpDiv |
Budgetary Resources |
Status of Budgetary Resources |
Net Outlays |
|---|---|---|---|
|
ACF |
$54,176 |
$54,176 |
$49,542 |
|
ACL |
1,936 |
1,936 |
1,680 |
|
AHRQ |
400 |
400 |
174 |
|
CDC |
14,319 |
14,319 |
10,800 |
|
CMS |
459,411 |
459,411 |
383,999 |
|
FDA |
5,590 |
5,590 |
2,331 |
|
HRSA |
11,189 |
11,189 |
9,126 |
|
IHS |
7,251 |
7,251 |
4,532 |
|
NIH |
34,681 |
34,681 |
29,233 |
|
OS |
6,167 |
6,167 |
2,810 |
|
PSC |
1,958 |
1,958 |
488 |
|
SAMHSA |
3,795 |
3,795 |
3,143 |
|
Totals |
$600,873 |
$600,873 |
$497,858 |
[1] "Other Agency Budgetary Accounts" includes the budgetary accounts of the 11 HHS responsibility segments other than CMS, as well as the remaining budgetary accounts not reported by CMS under Medicare and Medicaid. This includes budgetary resources of $3.9 billion and net outlays of $3.8 billion for the Vaccine for Children Program which are appropriated to the Medicaid program and transferred to the CDC.
Deferred Maintenance and Repairs
For the Years Ended September 30, 2015 and 2014
The Federal Accounting Standards Advisory Board (FASAB) issued SFFAS No. 42, Deferred Maintenance and Repairs: Amending Statement of Federal Financial Accounting Standards 6, 14, 29, and 32 effective for periods after September 30, 2014. This standard clarifies that repair activities should be included to better reflect asset management practices, and improve reporting on deferred maintenance and repairs. Deferred maintenance and repairs are maintenance and repairs activities not performed when they should have been or were scheduled to be, and then put off or delayed for a future period. Maintenance and repairs are the activities directed toward keeping fixed assets in acceptable condition, including preventive maintenance, normal repairs, replacement of parts and structural components, and other activities needed to preserve the asset so that it continues to provide acceptable service, meets applicable building codes, and achieves its expected life. Maintenance and repairs do not include activities aimed at expanding the capacity of an asset or otherwise upgrading it to serve needs different from, or significantly greater than, those originally intended. Maintenance and repair expenses are recognized as incurred. CDC, NIH, and FDA all use the condition assessment survey for all classes of property. IHS uses two methods to assess installations – annual general inspections and facility condition surveys. Deferred maintenance and repairs have been reported for all active and inactive assets; excess buildings and structures that are slated for disposal or demolition are not included. For buildings, equipment, and other structures, acceptable condition is defined in accordance with standards comparable to those used in private industry. For example, factors can include PP&E location, age, design etc. Prior year numbers have been adjusted to conform to SFFAS No. 42 and the current year presentation.
Estimated Cost to Return to Acceptable Condition (in Millions)
|
Category of Asset |
||
|---|---|---|
|
2015 |
2014 |
|
|
General PP&E |
|
|
|
Buildings |
$2,216 |
$1,773 |
|
Equipment |
13 |
12 |
|
Other Structures |
21 |
11 |
|
Total |
$2,250 |
$1,796 |
Social Insurance
Medicare, the largest health insurance program in the country, has helped fund medical care for the nation’s aged and disabled for five decades. A brief description of the provisions of Medicare’s Hospital Insurance (HI, or Part A) trust fund and Supplementary Medical Insurance (SMI, or Parts B and D) trust fund is included in this financial report.
The Required Supplementary Information (RSI) contained in this section is presented in accordance with the requirements of the FASAB. Included are descriptions of the long-term sustainability and financial condition of the program and a discussion of trends revealed in the data.
RSI material is generally drawn from the 2015 Annual Report of the Boards of Trustees of the Federal Hospital Insurance and Federal Supplementary Medical Insurance Trust Funds, which represents the official government evaluation of the financial and actuarial status of the Medicare trust funds. Unless otherwise noted, all data are for calendar years, and all projections are based on the Trustees’ intermediate set of assumptions.
The basis for the projections has changed since last year due to the enactment of the MACRA. This law repealed the SGR formula that set physician fee schedule payments, which were usually modified. In the 2014 report, the income, expenditures, and assets for Part B reflected the projected baseline scenario, which assumed an override of the SGR payment provisions and an increase in the physician fee schedule equal to the average of the most recent 10 years of SGR overrides (through March 2015) or 0.6 percent. Since the new legislation replaced the SGR system with specified payment updates for physicians, the projections in this year’s report are based on current law.
While the physician payment updates and new incentives put in place by MACRA avoid the significant short-range physician payment issues that would have resulted from the SGR system approach, they nevertheless raise important long-range concerns. In particular, additional payments of $500 million per year for one group of physicians and 5 percent annual bonuses for another group are scheduled to expire in 2025, resulting in a significant one-time payment reduction for most physicians. In addition, the law specifies the physician payment update amounts for all years in the future, and these amounts do not vary based on underlying economic conditions, nor are they expected to keep pace with the average rate of physician cost increases. The specified rate updates could be an issue in years when levels of inflation are high and would be problematic when the cumulative gap between the price updates and physician costs becomes large. The Trustees anticipate that physician payment rates under current law will be lower than they would have been under the SGR formula by 2048 and will continue to worsen thereafter. Absent a change in the delivery system or level of update by subsequent legislation, the Trustees expect access to Medicare-participating physicians to become a significant issue in the long term under current law.
Incorporated in these projections is the sequestration of non-salary Medicare expenditures as required by the following laws: the Budget Control Act of 2011 (Public Law 112-25, enacted on August 2, 2011), as amended by the American Taxpayer Relief Act of 2012; the Continuing Appropriations Resolution, 2014 (Public Law 113-67, enacted on December 26, 2013); Sections 1 and 3 of Public Law 113-82, enacted on February 15, 2014; and the Protecting Access to Medicare Act of 2014 (Public Law 113-93, enacted on April 1, 2014). The sequestration reduces benefit payments by 2 percent from April 1, 2013 through March 31, 2023, by 2.9 percent from April 1, 2023 through September 30, 2023, by 1.1 percent from October 1, 2023 through March 31, 2024, and by 4 percent from April 1, 2024 through September 30, 2024. Due to sequestration, non-salary administrative expenses are reduced by an estimated 5 percent from March 1, 2013 through September 30, 2024.
These projections also incorporate the effects of the Patient Protection and Affordable Care Act, as amended by the Health Care and Education Reconciliation Act of 2010. This legislation, referred to collectively as the Affordable Care Act, contained roughly 165 provisions affecting the Medicare program by reducing costs, increasing revenues, improving benefits, combating fraud and abuse, and initiating a major program of research and development to identify alternative provider payment mechanisms, health care delivery systems, and other changes intended to improve the quality of health care and reduce costs.
The financial projections for the Medicare program reflect substantial, but very uncertain, cost savings deriving from provisions of the Affordable Care Act and MACRA that lower increases in Medicare payment rates to most categories of health care providers. Without fundamental change in the current delivery system, these adjustments would probably not be viable indefinitely. It is conceivable that providers can improve their productivity, reduce wasteful expenditures, and take other steps to keep their cost growth within the bounds imposed by the Medicare price limitations. For such efforts to be successful in the long range; however, providers would have to generate and sustain unprecedented levels of productivity gains—a very challenging and uncertain prospect.
In view of the factors described above, it is important to note that Medicare’s actual future costs are highly uncertain for reasons apart from the inherent difficulty in projecting health care cost growth over time. The current-law cost projections reflect the physicians’ payment levels expected under the MACRA payment rules and the Affordable Care Act-mandated reductions in other Medicare payment rates. In addition, the Trustees reference in their report an illustrative alternative scenario, which assumes legislative changes that result in: (i) physician payment updates that transition from the update specified in current law for 2024 to the rate of growth in the Medicare Economic Index of 2.3 percent for 2039 and later; (ii) a partial phase-out of the Affordable Care Act reductions in Medicare payment rates; and (iii) an elimination of the cost-saving actions of the Independent Payment Advisory Board (IPAB). The difference between the illustrative alternative and the current-law projections demonstrates that the long-range costs could be substantially higher than shown throughout much of the report if the MACRA4 and Affordable Care Act5 cost-reduction measures prove problematic and new legislation scales them back.
Additional information on the current-law and illustrative alternative projections is provided in Note 25 in these financial statements, in appendix V.C of this year’s annual Medicare Trustees Report, and in an auxiliary memorandum prepared by the CMS Office of the Actuary at the request of the Board of Trustees.
Printed copies of the Trustees Report and auxiliary memorandum may be obtained from the CMS Office of the Actuary (410-786-6386) or can be downloaded from CMS's website.6
Actuarial Projections
Long-Range Medicare Cost Growth Assumptions
The assumed long-range rate of growth in annual Medicare expenditures per beneficiary is based on statutory price updates and volume and intensity growth derived from the “factors contributing to growth” model, which decomposes the major drivers of historical and projected health spending growth into distinct factors. The Trustees assume that the productivity reductions to Medicare payment rate updates will reduce volume and intensity growth by 0.1 percent below the factors model projection. The Trustees’ methodology is consistent with Finding III-2 and Recommendation III-2 of the 2010-2011 Medicare Technical Review Panel7 and incorporates refinements and improvements based on research conducted by the CMS Office of the Actuary.
In December 2011, the Technical Panel unanimously recommended a new approach that builds off of the longstanding GDP plus 1 percent assumption while incorporating several key refinements (Recommendation III-1).8 Specifically, the Panel recommended two separate means of establishing long-range growth rates:
- The first approach is a refinement to the traditional GDP plus 1 percent growth assumption that better accounts for the level of payment rate updates for Medicare (prior to the effects of the Affordable Care Act) compared to private health insurance and other payers of health care in the U.S. This refinement results in an increase in the long-range pre-Affordable Care Act baseline cost growth assumption for Medicare to GDP plus 1.4 percent.
- The “factors contributing to growth” model approach builds upon the key considerations underlying the earlier GDP plus 1 percent assumption. The model is based on economic research that decomposes health spending growth into its major drivers—income growth, relative medical price inflation, insurance coverage, and a residual factor that primarily reflects the impact of technological development.9 It benefits from additional information that was not available when the 2000 Technical Panel recommended the GDP plus 1 percent assumption.
The Trustees (i) used the statutory price updates and the volume and intensity assumptions from the factors model to derive the year-by-year Medicare cost growth assumptions for the last 50 years of the projection period and (ii) checked the ultimate Medicare cost growth assumptions derived from this approach for reasonableness by comparing them to results produced by an average “GDP plus” approach.
For some time, the Trustees have assumed that it is reasonable to expect over the long range that the drivers of health spending will be similar for the overall health sector and for the Medicare program. This view was affirmed by the 2010-2011 Technical Panel, which recommended use of the same long-range assumptions for the increase in the volume and intensity of health care services for the total health sector and for Medicare. Therefore, the overall health sector long-range cost growth assumptions for volume and intensity are used as the starting point for developing the Medicare-specific assumptions.
Prior to the Affordable Care Act, Medicare payment rates for most non-physician provider categories were updated annually by the increase in providers’ input prices for the market basket of employee wages and benefits, facility costs, medical supplies, energy and utility costs, professional liability insurance, and other inputs needed to produce the health care goods and services. To the extent that health care providers can improve their productivity each year, their net costs of production (other things being equal) will increase more slowly than their input prices—but the Medicare payment rate updates prior to the Affordable Care Act were not adjusted for potential productivity gains. Accordingly, Medicare costs per beneficiary would have increased somewhat faster than for the health sector overall.10 The Affordable Care Act requires that many of these Medicare payment updates be reduced by the 10-year moving average increase in economy-wide private nonfarm business multifactor productivity,11 which the Trustees assume will be 1.1 percent per year over the long range. The different statutory provisions for updating payment rates require the development of separate long-range Medicare cost growth assumptions for four categories of health care providers:
- All HI, and some SMI Part B, services that are updated annually by provider input price increases less the increase in economy-wide productivity.
HI services are inpatient hospital, skilled nursing facility, home health, and hospice. The primary Part B services affected are outpatient hospital, home health, and dialysis. Under the Trustees’ intermediate economic assumptions, the year-by-year per capita increases for these provider services start at 4.0 percent in 2039, or GDP plus 0.0 percent, declining gradually to 3.6 percent in 2089, or GDP minus 0.3 percent.
- Physician services
Payment rate updates are 0.75 percent per year under the assumption that all physicians would be participating in alternative payment models (APMs). The year-by-year per capita growth rates for physician payments are assumed to be 3.3 percent in 2039, or GDP minus 0.7 percent, declining to 2.8 percent in 2089, or GDP minus 1.1 percent.
- Certain SMI Part B services that are updated annually by the CPI increase less the increase in economy-wide productivity.
Such services include durable medical equipment,12 care at ambulatory surgical centers, ambulance services, and medical supplies. The Trustees assume the per beneficiary year-by-year rates to be 3.3 percent in 2039, or GDP minus 0.7 percent, declining to 2.8 percent in 2089, or GDP minus 1.1 percent.
- All other Medicare services, for which payments are established based on market processes, such as prescription drugs provided through Part D and the remaining Part B services.
These Part B outlays constitute an estimated 15 percent of total Part B expenditures in 2024 and consist mostly of payments for laboratory tests, physician-administered drugs, and small facility services. Medicare payments to Part D plans are based on a competitive-bidding process and are not affected by the productivity adjustments. Similarly, payments for the other Part B services are based on market factors.13 The long-range per beneficiary cost growth rate for Part D and these Part B services is assumed to equal the increase in per capita national health expenditures as determined from the factors model. The corresponding year-by-year per capita growth rates for these services are 4.9 percent in 2039, or GDP plus 0.9 percent, declining to 4.4 percent by 2089, or GDP plus 0.5 percent.
In addition, these long-range cost growth rates must be modified to reflect demographic impacts. For example, beneficiaries at ages 80 and above use Part A skilled nursing and home health services much more frequently than do younger beneficiaries. As the beneficiary population ages, Part A costs will grow at a faster rate due to increased use of these services. In contrast, the incidence of prescription drug use is more evenly distributed by age, and an increase in the average age of Part D enrollees has significantly less of an effect on Part D costs.
After combining the rates of growth from the three long-range assumptions, the weighted average growth rate for Part B is 3.8 percent per year for the last 50 years of the projection period, or GDP minus 0.2 percent, on average. When Parts A, B, and D are combined, the weighted average growth rate is 4.0 percent over this same time period or GDP minus 0.0 percent, while the growth rate in 2089 is 3.7 percent or GDP minus 0.2 percent.
HI Cash Flow as a Percentage of Taxable Payroll
Each year, estimates of the financial and actuarial status of the HI trust fund are prepared for the next 75 years. It is difficult to meaningfully compare dollar values for different periods without some type of relative scale; therefore, income and expenditure amounts are shown relative to the earnings in covered employment that are taxable under HI (referred to as taxable payroll).
Chart 1 illustrates income (excluding interest) and expenditures as a percentage of taxable payroll over the next 75 years. The projected HI cost rates shown in the 2015 report are lower than those from the 2014 report for all years in the long range, primarily due to modified income-technology and price elasticity assumptions.
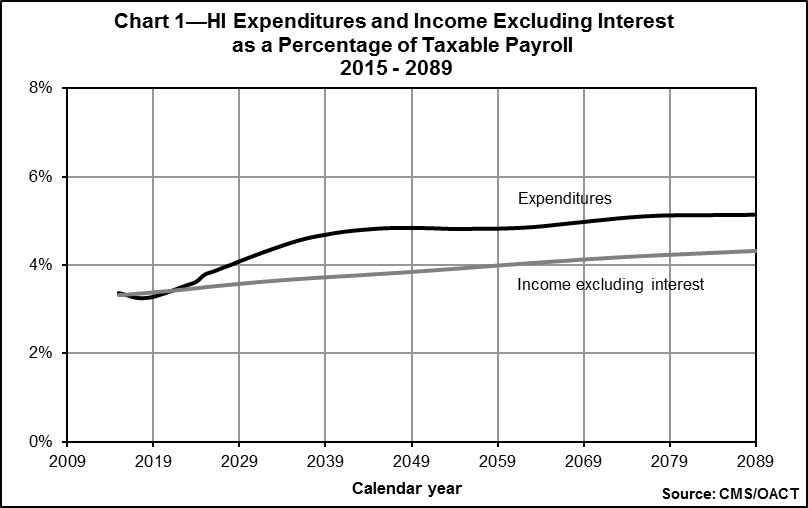
Since the standard HI payroll tax rates are not scheduled to change in the future under present law, most payroll tax income, as a percentage of taxable payroll, is estimated to remain constant at 2.90 percent. In addition, high-income workers pay an additional 0.9 percent of their earnings above $200,000 (for single workers) or $250,000 (for married couples filing joint income tax returns) in 2013 and later. Because these income thresholds are not indexed, over time an increasing proportion of workers will become subject to the additional HI tax rate, and consequently total HI payroll tax revenues will increase steadily as a percentage of taxable payroll. Income from taxation of benefits will also increase as a greater proportion of Social Security beneficiaries become subject to such taxation, since the income thresholds determining taxable benefits are not indexed for price inflation. Thus, as Chart 1 shows, the income rate is expected to gradually increase over current levels.
As indicated in Chart 1, the cost rate is projected to decline through 2018, largely due to: (i) expenditure growth that was constrained in part by the sequester and low payment updates; and (ii) a rebound of taxable payroll growth from recession levels. After 2018, the cost rate is projected to rise primarily due to retirements of those in the baby boom generation and partly due to a projected return to modest health services cost growth. This cost rate increase is moderated by the accumulating effect of the productivity adjustments to provider price updates, which are estimated to reduce annual HI per capita cost growth by an average of 1.0 percent through 2024 and 1.1 percent thereafter. Under the illustrative alternative scenario, if the slower price updates were not feasible in the long range and were phased down during 2020-2034, then the HI cost rate would be 4.8 percent in 2035 and 8.1 percent in 2085. These levels are about 7 percent and 58 percent higher, respectively, than the current-law estimates under the intermediate assumptions.
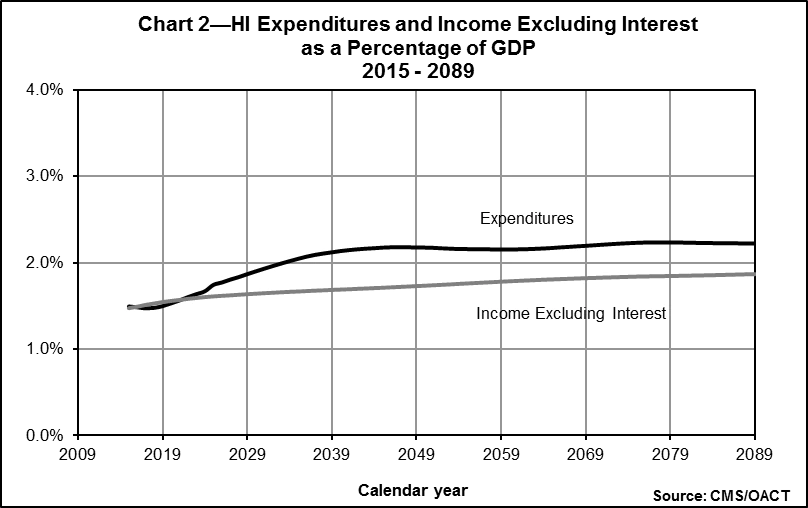
HI and SMI Cash Flow as a Percentage of GDP
Expressing Medicare incurred expenditures as a percentage of GDP gives a relative measure of the size of the Medicare program compared to the general economy. The GDP represents the total value of goods and services produced in the U.S. This measure provides an idea of the relative financial resources that will be necessary to pay for Medicare services.
HI
Chart 2 shows HI income (excluding interest) and expenditures over the next 75 years expressed as a percentage of GDP. In 2014, the expenditures were $269.3 billion, which was 1.5 percent of GDP. This percentage is projected to increase steadily until about 2045 and then remain fairly level throughout the rest of the 75-year period, as the accumulated effects of the price update reductions are realized. Based on the illustrative alternative scenario, HI costs as a percentage of GDP would increase steadily throughout the long-range projection period, reaching 3.6 percent in 2089.
SMI
Because of the Part B and Part D financing mechanism in which income mirrors expenditures, it is not necessary to test for long-range imbalances between income and expenditures. Rather, it is more important to examine the projected rise in expenditures and the implications for beneficiary premiums and federal general revenue payments.
Chart 3 shows projected total SMI (Part B and Part D) expenditures and premium income as a percentage of GDP. The growth rates are estimated year by year for the next 10 years, reflecting the impact of specific statutory provisions. Expenditure growth for years 11 to 25 is assumed to grade smoothly into the long-range assumption described previously.
In 2014, SMI expenditures were $344.0 billion, or about 2.0 percent of GDP. Under current law, they would grow to about 3.5 percent of GDP within 25 years and to 3.8 percent by the end of the projection period. (Under the illustrative alternative, total SMI expenditures in 2089 would be 5.4 percent of GDP.)
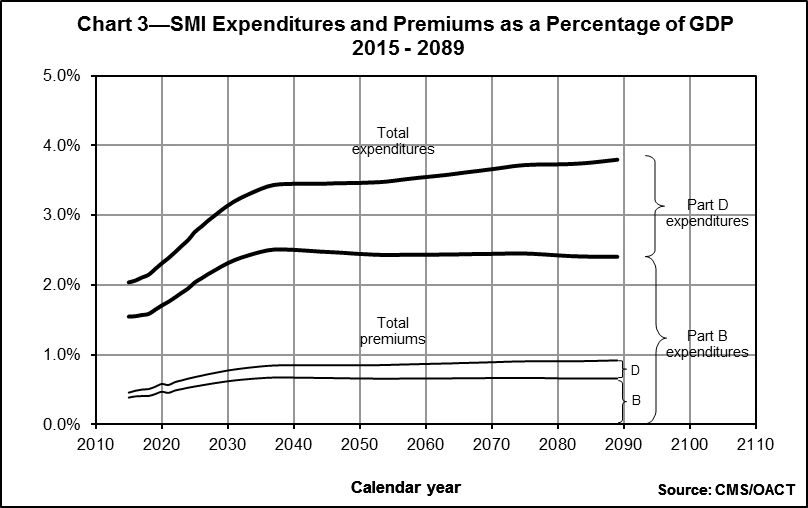
To match the faster growth rates for SMI expenditures, beneficiary premiums, along with general revenue contributions, would increase more rapidly than GDP over time but at a slower rate compared to the last 10 years. Average per beneficiary costs for Part B and Part D benefits are projected to increase after 2015 by about 4.3 percent annually. The associated beneficiary premiums—and general revenue financing—would increase by approximately the same rate. The special state payments to the Part D account are set by law at a declining portion of the states’ forgone Medicaid expenditures attributable to the Medicare drug benefit. The percentage was 90 percent in 2006, phasing down to 75 percent in 2015 and later. Then, after 2015, the state payments are also expected to increase faster than GDP.
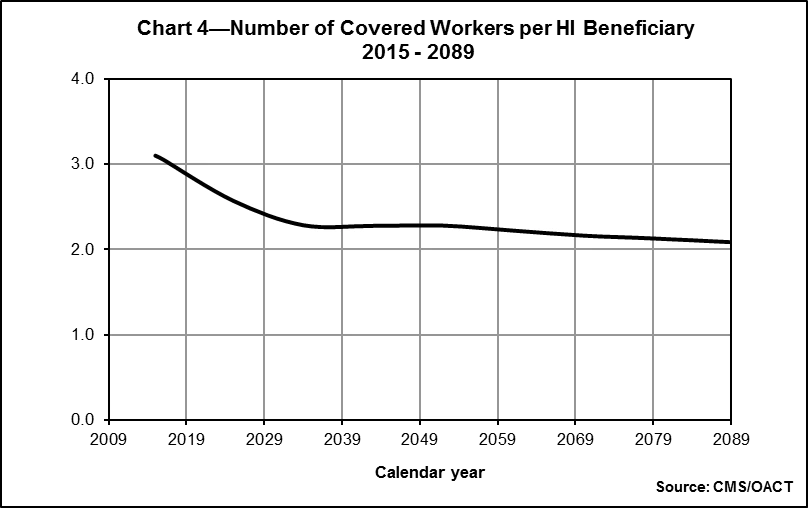
Worker-to-Beneficiary Ratio
HI
Another way to evaluate the long-range outlook of the HI trust fund is to examine the projected number of workers per HI beneficiary. Chart 4 illustrates this ratio over the next 75 years. For the most part, current workers pay for current benefits. The relatively smaller number of persons born after the baby boom will therefore finance the retirement of the baby boom generation. In 2014, every beneficiary had 3.2 workers to pay for his or her benefit. In 2030, however, after the last baby boomer turns 65, there will be only about 2.4 workers per beneficiary. The projected ratio continues to decline until there are just 2.1 workers per beneficiary by 2089
Sensitivity Analysis
To prepare projections regarding the future financial status of the HI and SMI trust funds, various assumptions have to be made. First and foremost, the estimates presented here are based on the assumption that both trust funds will continue under present law. In addition, the estimates depend on many economic and demographic assumptions. Because of revisions to these assumptions, due to either changed conditions or updated information, estimates sometimes change substantially compared to those made in prior years. Furthermore, it is important to recognize that actual conditions are very likely to differ from the projections presented here, since the future cannot be anticipated with certainty.
To illustrate the sensitivity of the long-range projections and determine the impact on the HI actuarial present values, six of the key assumptions were varied individually.14 The assumptions varied are the health care cost factors, real-wage differential, CPI, real-interest rate, fertility rate, and net immigration.15
For this analysis, the intermediate economic and demographic assumptions in the 2015 Annual Report of the Boards of Trustees of the Federal Hospital Insurance and Federal Supplementary Medical Insurance Trust Funds are used as the reference point. Each selected assumption is varied individually to produce three scenarios. All present values are calculated as of January 1, 2015 and are based on estimates of income and expenditures during the 75-year projection period.
Charts 5 through 10 show the present value of the estimated net cash flow for each assumption varied. Generally, under all three scenarios, the present values initially increase, as the effects of the Affordable Care Act result in trust fund surpluses, and then decrease through the first 25 to 30 years of the projection period, at which point they start to increase (or become less negative) once again. This pattern occurs in part because of the discounting process used for computing present values, which is used to help interpret the net cash flow deficit in terms of today’s dollar. In other words, the amount required to cover this deficit, if made available and invested today, begins to decrease at the end of the 75-year period, reflecting the long period of interest accumulation that would occur. The pattern is also affected by the accumulating impact of the lower Medicare price updates over time and the greater proportion of workers who will be subject to the higher HI payroll tax rate, as noted above.
Health Care Cost Factors
Table 1 shows the net present value of cash flow during the 75-year projection period under three alternative assumptions for the annual growth rate in the aggregate cost of providing covered health care services to beneficiaries. These assumptions are that the ultimate annual growth rate in such costs, relative to taxable payroll, will be 1 percent slower than the intermediate assumptions, the same as the intermediate assumptions, and 1 percent faster than the intermediate assumptions. In each case, the taxable payroll will be the same as assumed for the intermediate assumptions.
|
Table 1—Present Value of Estimated HI Income Less Expenditures under Various Health Care Cost Growth Rate Assumptions |
|||
|---|---|---|---|
|
Annual cost/payroll relative growth rate |
-1 percentage point |
Intermediate assumptions |
+1 percentage point |
|
Income minus expenditures (in billions) |
$2,743 |
-$3,187 |
-$12,594 |
Table 1 demonstrates that if the ultimate growth rate assumption is 1 percentage point lower than the intermediate assumptions, the deficit decreases by $5,930 billion. On the other hand, if the ultimate growth rate assumption is 1 percentage point higher than the intermediate assumptions, the deficit increases substantially, by $9,407 billion.
Chart 5 shows projections of the present value of the estimated net cash flow under the three alternative annual growth rate assumptions presented in Table 1.
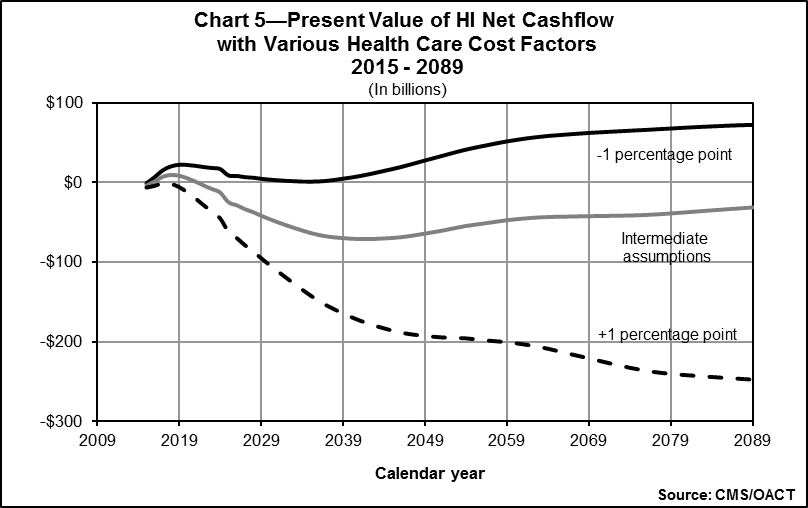
This assumption has a dramatic impact on projected HI cash flow. The present value of the net cash flow under the ultimate growth rate assumption of 1 percentage point lower than the intermediate assumption actually becomes a surplus and remains positive throughout the entire period, due to the improved financial outlook for the HI trust fund as a result of the Affordable Care Act. Several factors, such as the utilization of services by beneficiaries or the relative complexity of services provided, can affect costs without affecting tax income. As Chart 5 indicates, the financial status of the HI trust fund is extremely sensitive to the relative growth rates for health care service costs.
Real-Wage Differential
Table 2 shows the net present value of cash flow during the 75-year projection period under three alternative ultimate real-wage differential assumptions: 0.6, 1.2, and 1.8 percentage points.16 In each case, the assumed ultimate annual increase in the CPI is 2.7 percent, yielding ultimate percentage increases in nominal average annual wages in covered employment of 3.3, 3.9, and 4.5 percent, respectively.
|
Table 2—Present Value of Estimated HI Income Less Expenditures under Various Real-Wage Assumptions |
|||
|---|---|---|---|
|
Ultimate percentage increase in wages − CPI |
3.3 − 2.7 |
3.9 − 2.7 |
4.5 − 2.7 |
|
Ultimate percentage increase in real-wage differential |
0.6 |
1.2 |
1.8 |
|
Income minus expenditures (in billions) |
-$4,365 |
-$3,187 |
-$1,326 |
As indicated in Table 2, for a half-point increase in the ultimate real-wage differential assumption, the deficit—expressed in present-value dollars—decreases by approximately $1,550 billion. Conversely, for a half-point decrease in the ultimate real-wage differential assumption, the deficit increases by about $980 billion.
Chart 6 shows projections of the present value of the estimated net cash flow under the three alternative real-wage differential assumptions presented in Table 2
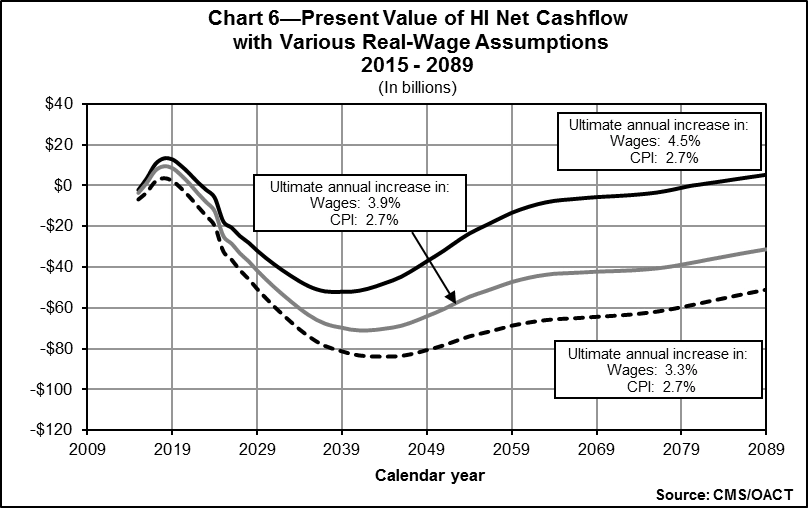
As illustrated in Chart 6, faster real-wage growth results in smaller HI cash flow deficits, when expressed in present-value dollars. A higher real-wage differential immediately increases both HI expenditures for health care and wages for all workers. There is a full effect on wages and payroll taxes, but the effect on benefits is only partial, since not all health care costs are wage-related. In practice, faster real-wage growth always improves the financial status of the HI trust fund, regardless of whether there is a small or large imbalance between income and expenditures. Also, as noted previously, the closer financial balance for the HI trust fund under the Affordable Care Act and MACRA depends critically on the long-range feasibility of the lower Medicare price updates for hospitals and other HI providers. There is a strong possibility that certain payment changes will not be viable in the long range.
Consumer Price Index
Table 3 shows the net present value of cash flow during the 75-year projection period under three alternative ultimate CPI rate-of-increase assumptions: 3.4, 2.7, and 2.0 percent. In each case, the assumed ultimate real-wage differential is 1.2 percent, which yields ultimate percentage increases in average annual wages in covered employment of 4.6, 3.9, and 3.2 percent, respectively.
Table 3 demonstrates that if the ultimate CPI-increase assumption is 3.4 percent, the deficit decreases by $801 billion. On the other hand, if the ultimate CPI-increase assumption is 2.0 percent, the deficit increases by $1,034 billion.
Chart 7 shows projections of the present value of net cash flow under the three alternative CPI rate-of-increase assumptions presented in Table 3
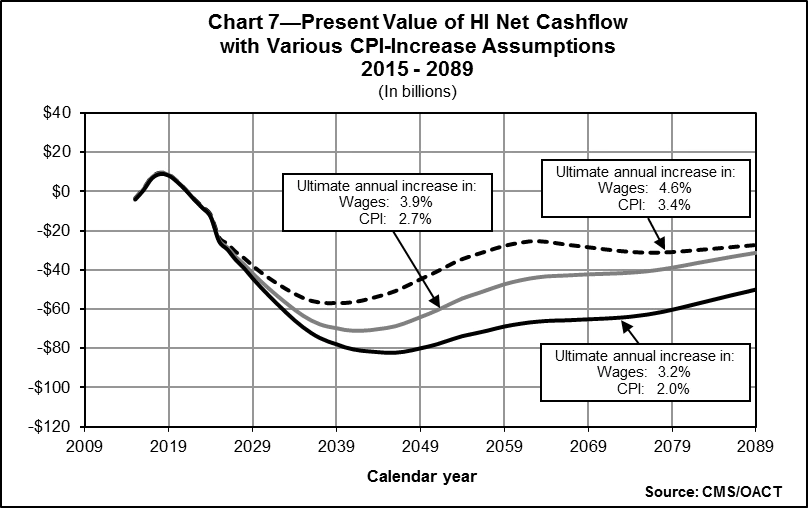
As Chart 7 indicates, this assumption has a small impact when the cash flow is expressed as present values. The relative insensitivity of the projected present values of HI cash flow to different levels of general inflation occurs because inflation tends to proportionately affect both income and costs in a similar manner. In present value terms, a smaller deficit results under high-inflation conditions because the present values of HI expenditures are not significantly different under the various CPI scenarios, but under high-inflation conditions the present value of HI income increases as more people become subject to the additional 0.9 percent HI tax rate required by the Affordable Care Act for workers with earnings above $200,000 or $250,000 (for single and joint income-tax filers, respectively). Since the thresholds are not indexed, additional workers become subject to the additional tax more quickly under conditions of faster inflation, and vice versa.
Real-Interest Rate
Table 4 shows the net present value of cash flow during the 75-year projection period under three alternative ultimate annual real-interest assumptions: 2.4, 2.9, and 3.4 percent. In each case, the assumed ultimate annual increase in the CPI is 2.7 percent, which results in ultimate annual yields of 5.1, 5.6, and 6.1 percent, respectively.
|
Table 4—Present Value of Estimated HI Income |
|||
|---|---|---|---|
|
Ultimate real-interest rate |
2.4 percent |
2.9 percent |
3.4 percent |
|
Income minus expenditures (in billions) |
-$3,774 |
-$3,187 |
-$2,704 |
As illustrated in Table 4, for every increase of 0.1 percentage point in the ultimate real-interest rate, the deficit decreases by approximately $105 billion.
Chart 8 shows projections of the present value of the estimated net cash flow under the three alternative real-interest assumptions presented in Table 4
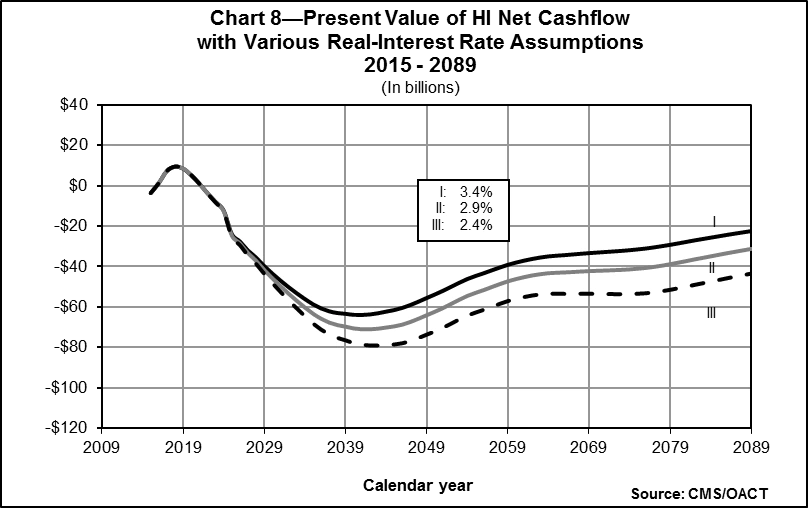
As shown in Chart 8, the projected HI cash flow, when expressed in present values, is fairly sensitive to the interest assumption. This is not an indication of the actual role that interest plays in HI financing. In actuality, interest finances very little of the cost of the HI trust fund because, under the intermediate assumptions, the fund is projected to be relatively low and exhausted by 2030. These results illustrate the substantial sensitivity of present value measures to different interest rate assumptions. With higher assumed interest, the very large deficits in the more distant future are discounted more heavily (that is, are given less weight), resulting in a smaller overall net present value.
Fertility Rate
Table 5 shows the net present value of cash flow during the 75-year projection period under three alternative ultimate fertility rate assumptions: 1.8, 2.0, and 2.2 children per woman.
|
Table 5—Present Value of Estimated HI Income |
|||
|---|---|---|---|
|
Ultimate fertility rate1 |
1.8 |
2.0 |
2.2 |
|
Income minus expenditures (in billions) |
-$3,547 |
-$3,187 |
-$2,793 |
|
1The total fertility rate for any year is the average number of children who would be born to a woman in her lifetime if she were to experience the birth rates by age observed in, or assumed for, the selected year and if she were to survive the entire childbearing period. |
|||
As Table 5 demonstrates, for an increase of 0.2 in the assumed ultimate fertility rate, the projected present value of the HI deficit decreases by approximately $375 billion.
Chart 9 shows projections of the present value of the net cash flow under the three alternative fertility rate assumptions presented in Table 5
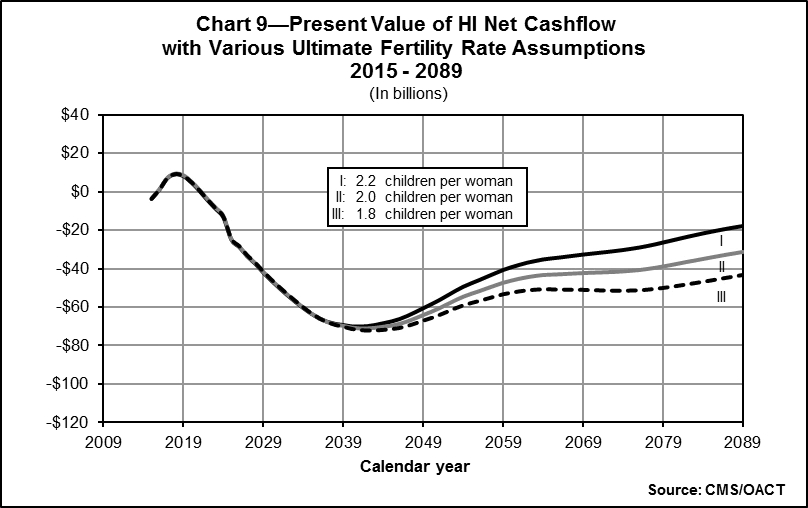
As Chart 9 indicates, the fertility rate assumption has a substantial impact on projected HI cash flows. Under the higher fertility rate assumptions, there will be additional workers in the labor force after 20 years, but their impact on future HI taxes will be relatively greater, since many will become subject to the additional HI tax, thereby lowering the deficit proportionately more on a present-value-dollar basis. On the other hand, under the lower fertility rate assumptions, there will be fewer workers in the workforce with a smaller number subject to the additional tax, in turn raising the HI deficit. It is important to point out that if a longer projection period were used, the impact of a fertility rate change would be more pronounced.
Net Immigration
Table 6 shows the net present value of cash flow during the 75-year projection period under three alternative average annual net immigration assumptions: 850,000 persons, 1,155,000 persons, and 1,465,000 persons per year.
|
Table 6—Present Value of Estimated HI Income |
|||
|---|---|---|---|
|
Average annual net immigration |
850,000 |
1,155,000 |
1,465,000 |
|
Income minus expenditures (in billions) |
-$3,455 |
-$3,187 |
-$2,981 |
As indicated in Table 6, if the average annual net immigration assumption is 850,000 persons, the deficit—expressed in present-value dollars—increases by $268 billion. Conversely, if the assumption is 1,465,000 persons, the deficit decreases by $206 billion.
Chart 10 shows projections of the present value of net cash flow under the three alternative average annual net immigration assumptions presented in Table 6
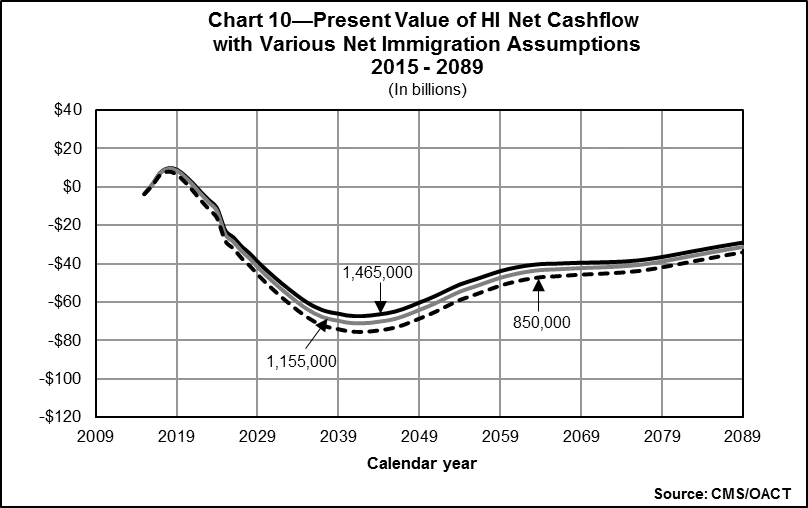
Higher net immigration results in smaller HI cash flow deficits, as illustrated in Chart 10. Since immigration tends to occur most often among people at working ages, who work and pay taxes into the HI system, a change in the net immigration assumption affects revenues from payroll taxes almost immediately. However, the impact on expenditures occurs later as those individuals age and become beneficiaries.
Trust Fund Finances and Sustainability
HI
The short-range financial outlook for the HI trust fund is about the same as projected in last year’s annual report, as factors causing improved finances are offset by other changes. Under the Medicare Trustees’ intermediate assumptions, the estimated depletion date for the HI trust fund is 2030, the same as in last year’s report. As in past years, the Trustees have determined that the fund is not adequately financed over the next 10 years. HI tax income in 2014 was somewhat higher than last year’s estimate, mostly due to adjustments for prior years,17 but is projected to be slightly lower through 2019; after 2019, however, projections of earnings throughout the period are higher mostly due to assumptions of slower projected growth in employer-sponsored health insurance—a factor that increases wages. Although HI expenditures in 2014 were nearly equal to the previous estimate, projected expenditures are higher at the end of the 10-year period than shown in last year’s report, largely due to increases in provider payment update assumptions that reflect recent trends.
HI expenditures have exceeded income annually since 2008. However, the Trustees project slight surpluses in 2015 through 2023, with a return to deficits thereafter until the trust fund becomes depleted in 2030. If assets were depleted, Medicare could pay health plans and providers of Part A services only to the extent allowed by ongoing tax revenues—and these revenues would be inadequate to fully cover costs. Beneficiary access to health care services would rapidly be curtailed. To date, Congress has never allowed the HI trust fund to become depleted.
The HI trust fund remains out of financial balance in the long range. Bringing the fund into actuarial balance over the next 75 years under the intermediate assumptions would require significant increases in revenues and/or reductions in benefits. Policy makers should determine effective solutions to ensure the financial integrity of HI in the long term and should also consider the likelihood that the price adjustments in current law may prove difficult to adhere to fully and may require even more changes to address this challenge.
SMI
The SMI trust fund will remain adequate, both in the near term and into the indefinite future, because of the automatic financing established for Parts B and D. There is no provision in the law for transferring assets between the Part D and Part B accounts; therefore, it is necessary to evaluate each account’s financial adequacy separately.
The financing established for the Part B account for calendar year 2015 is adequate to cover 2015 expected expenditures but would need to be increased in future years in order to restore the financial status of the Part B account to a satisfactory level.18 Similarly, Part D income and outgo would remain in balance as a result of the annual adjustment of premium and general revenue income to cover costs. The appropriation for Part D general revenues has generally been set such that amounts can be transferred to the Part D account on an as-needed basis.
The Part B and Part D accounts in the SMI trust fund are adequately financed because premium and general revenue income are reset each year to cover expected costs. Such financing, however, would have to increase faster than the economy to cover expected expenditure growth. A critical issue for the SMI program is the impact of the rapid growth of SMI costs, which places steadily increasing demands on beneficiaries and taxpayers.
Medicare Overall
The Medicare Modernization Act requires the Board of Trustees to determine whether the difference between Medicare outlays and dedicated financing sources19is projected to exceed 45 percent of total Medicare outlays under current law within the next seven fiscal years (2015-2021). If this level is attained within the seven year timeframe, federal law requires a determination of projected excess general revenue Medicare funding. For the 2015 Medicare Trustees Report, this difference is not expected to exceed 45 percent of total expenditures in fiscal years 2015-2021 (the first seven years of the projection), and therefore the Trustees are not issuing this determination.
The projections shown continue to demonstrate the need for timely and effective action to address Medicare’s remaining financial challenges—including the projected depletion of the HI trust fund, this fund’s long-range financial imbalance, and the rapid growth in Medicare expenditures. Furthermore, if the growth in Medicare costs is comparable to growth under the illustrative alternative projections, then these further policy reforms will have to address much larger financial challenges than those assumed under current law. In their 2015 annual report to Congress, the Medicare Board of Trustees emphasized the seriousness of these concerns and urged the nation’s policy makers to “work closely together with a sense of urgency to address these challenges.” They also stated: “Consideration of such reforms should not be delayed.”
Also see these sections of the Agency Financial Report:
- Section I: Management, Discussion and Analysis
- Section II: Financial Section - Subsection 1
- Section II: Financial Section - Subsection 2
- Section III: Other Information
- Appendices
Return to AFR Homepage
[4] Under MACRA, a significant one-time payment reduction is scheduled for most physicians in 2025. In addition, the law specifies physician payment rate updates of 0.75 percent or 0.25 percent annually thereafter. These updates are notably lower than the projected physician cost increases, which are assumed to average 2.3 percent per year in the long range.
[5] Under the Affordable Care Act, Medicare’s annual payment rate updates for most categories of providers would be reduced below the increase in providers’ input prices by the growth in economy-wide private nonfarm business multifactor productivity (1.1 percent over the long range). In addition, the IPAB would be charged with recommending cost savings as are necessary to hold overall per capita Medicare growth to the average of the Consumer Price Index (CPI-U) and CPI-medical increases in 2015-2019 and to the rate of per capita GDP growth plus 1 percentage point thereafter (subject to certain limits). Unless overridden by lawmakers, these recommendations would be implemented automatically.
[6] The notes to the financial statements include URL references to certain websites. The information contained on those websites is not part of the financial statement presentation.
[7] The Panel’s final report is available at ASPE's website.
[8] For convenience, the increase in Medicare expenditures per beneficiary, before consideration of demographic impacts, is referred to as the Medicare cost growth rate. Similarly, these growth rate assumptions are described relative to the per capita increase in GDP and characterized simply as GDP plus X percent.
[9] Smith, Sheila, Newhouse, Joseph P., and Freeland, Mark S. “Income, Insurance, and Technology: Why Does Health Spending Outpace Economic Growth?” Health Affairs, 28, no. 5 (2009): 1276-1284.
[10] Historically, lawmakers frequently reduced the payment updates below the increase in providers’ input prices in an effort to slow Medicare cost growth or to offset unwarranted changes in claims coding practices. Prior to the Affordable Care Act, the law did not specify any such adjustments after 2009.
[11] For convenience the term economy-wide private nonfarm business multifactor productivity will henceforth be referred to as economy-wide productivity.
[12] Certain durable medical equipment (DME) is subject to competitive bidding, and the price is assumed to grow by the CPI increase less the increase in economy-wide productivity, the same update specified for DME not subject to bidding.
[13] For example, physician-administered Part B drugs are reimbursed at the level of the average sales price in the market plus 6 percent.
[14] Sensitivity analysis is not done for Parts B or D of the SMI trust fund due to the financing mechanism for each account. Any change in assumptions would have a negligible impact on the net cash flow, since the change would affect income and expenditures equally.
[15] The sensitivity of the projected HI net cash flow to variations in future mortality rates is also of interest. At this time, however, relatively little is known about the relationship between improvements in life expectancy and the associated changes in health status and per beneficiary health expenditures. As a result, it is not possible at present to prepare meaningful estimates of the HI mortality sensitivity.
[16] The real-wage differential is the difference between the percentage increases in the average annual wage in covered employment and the average annual CPI.
[17] Initial appropriations of payroll taxes are made on an estimated basis, and then each year adjustments are made to the appropriations for prior years to reflect actual tax receipts.
[18] In 2016, a hold-harmless provision that restricts Part B premium increases for most beneficiaries is expected to cause a substantial increase in the Part B premium rate for other beneficiaries.
[19]Dedicated Medicare financing sources include HI payroll taxes; income from taxation of Social Security benefits; State transfers for the prescription drug benefit; premiums paid under Parts A, B, and D; fees allocated to Part B related to brand-name prescription drugs; and any gifts received by the Medicare trust funds.