Numbers at a Glance

(As of April 30, 2013)

Topics on this page:


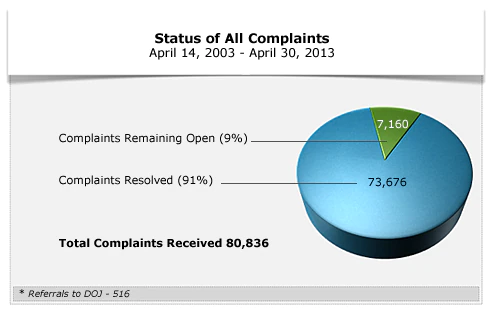
Status of All Complaints  
Complaints Remaining Open 7,160 9% of Total
Complaints Resolved 73,676 91% of Total
Total Complaints Received 80,836  

* Referrals to DOJ - 516

Back to Top


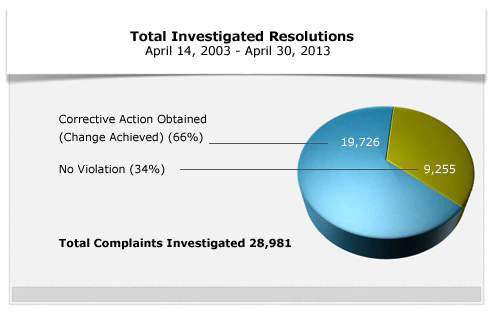
Total Investigated Resolutions    
Corrective Action Obtained (Change Achieved) 19,726 66% of Total
No Violation 9,255 34% of Total
Total Complaints Investigated 28,981  


Back to Top


Bar graph showing Investigated Resolutions. 2003 79 no violation; 260 corrective action; 339 total. 2004 359 no violation; 1,033 corrective action; 1,392 total. 2005 642 no violation; 1,161 corrective action; 1,803 total. 2006 895 no violation; 1,571 corrective action; 2,466 total. 2007 715 no violation; 1,484 corrective action, 2,199 total. 2008 1,163 no violation; 2,210 corrective action; 3,373 total. 2009 1,196 no violation, 2,140 corrective action, 3,336 total. 2010 1,526 no violation, 2,703 corrective action, 4,229 total, 2011 1,303 no violation, 2,595 corrective action, 3,898 total.

Back to Top

Content created by Office for Civil Rights (OCR)
Content last reviewed on July 26, 2013