Numbers at a Glance

(As of November 30, 2013)

Topics on this page:


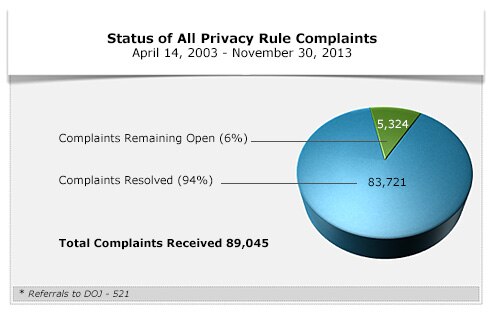
Status of All Complaints  
Complaints Remaining Open 5,324 6% of Total
Complaints Resolved 83,721 94% of Total
Total Complaints Received 89,045  

* Referrals to DOJ - 520

Back to Top


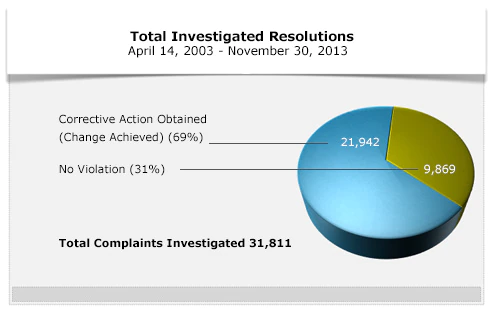
Total Investigated Resolutions    
Corrective Action Obtained (Change Achieved) 21,942 69% of Total
No Violation 9,869 31% of Total
Total Complaints Investigated 31,811  


Back to Top


This bar graph shows a comparison of the complaints that OCR has investigated and resolved by calendar year according to the type of closure, and includes a bar reflecting the total closures. The first bar in the group of three per year represents the complaints closed in which there was no violation, the second in which there was corrective action, and the third reflects the total closures. In partial year 2003, there were 79 no violation closures and 260 corrective action, for a total of 339. In 2004, there were 360 no violation closures and 1,033 corrective action, for a total of 1,393. In 2005, there were 642 no violation closures and 1,162 corrective action, for a total of 1,804. In 2006, there were 897 no violation closures and 1,574 corrective action, for a total of 2,471. In 2007, there were 727 no violation closures and 1,494 corrective action, for a total of 2,221. In 2008, there were 1,180 no violation closures, 2, 221 corrective action, for a total of 3,401. In 2009, there were 1,211 no violation closures, 2,146 corrective action, for a total of 3,357. In 2010, there were 1,529 no violation closures, 2,709 corrective action, for a total of 4,238. In 2011, there were 1,302 no violation closures, 2,595 corrective action, for a total of 3,897. In 2012, there were 979 no violation closures, 3,363 corrective action, for a total of 4,342.

Back to Top

Content created by Office for Civil Rights (OCR)
Content last reviewed on July 26, 2013