

Numbers at a Glance
(As of September 30, 2015)
Topics on this page:
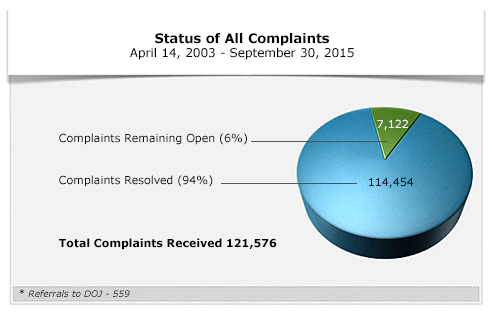
| Status of All Privacy Rule Complaints - September 2015 | ||
|---|---|---|
| Complaints Remaining Open | 7,122 | 6% |
| Complaints Resolved | 114.454 | 94% |
| Total Complaints Received | 121,576 | |
* Referrals to DOJ - 559
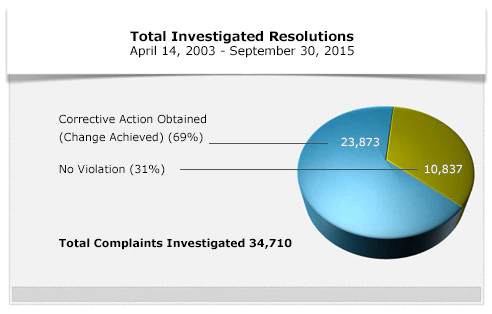
| Total Investigated Resolutions - September 2015 | ||
|---|---|---|
| Corrective Action Obtained (Change Achieved) | 23,873 | 69% |
| No Violation | 10,837 | 31% |
| Total Complaints Investigated | 34,710 |
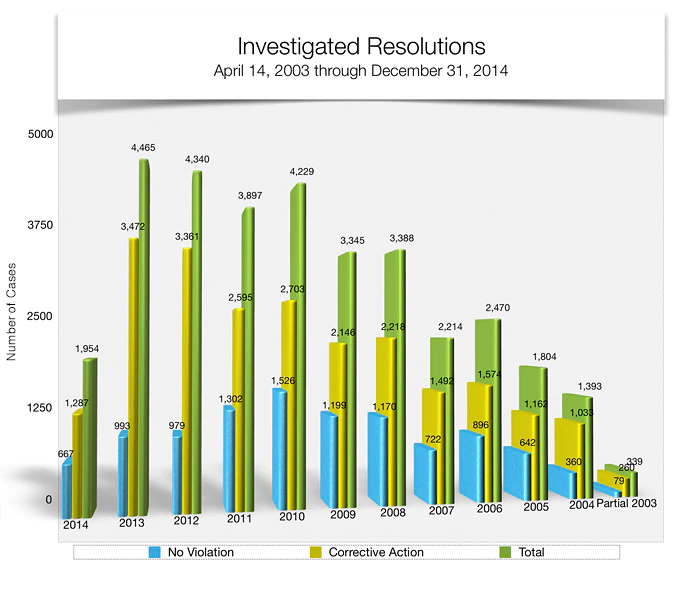
This bar graph shows a comparison of the complaints that OCR has investigated and resolved by calendar year according to the type of closure, and includes a bar reflecting the total closures. The first bar in the group of three per year represents the complaints closed in which there was no violation, the second in which there was corrective action, and the third reflects the total closures.
|
YEAR |
INVESTIGATED: NO VIOLATION |
INVESTIGATED: CORRECTIVE ACTION |
TOTAL |
|---|---|---|---|
|
Partial Year 2003 |
79 |
260 |
339 |
|
2004 |
360 |
1033 |
1393 |
|
2005 |
642 |
1162 |
1804 |
|
2006 |
897 |
1574 |
2471 |
|
2007 |
727 |
1494 |
2221 |
|
2008 |
1180 |
2221 |
3401 |
|
2009 |
1211 |
2146 |
3357 |
|
2010 |
1529 |
2709 |
4238 |
|
2011 |
1302 |
2595 |
3897 |
|
2012 |
979 |
3361 |
4340 |
|
2013 |
993 |
3470 |
4463 |

