Enforcement Results by Year – Compliance Reviews
This page contains historical data. For current data please visit our Enforcement Results by Calendar Year page.
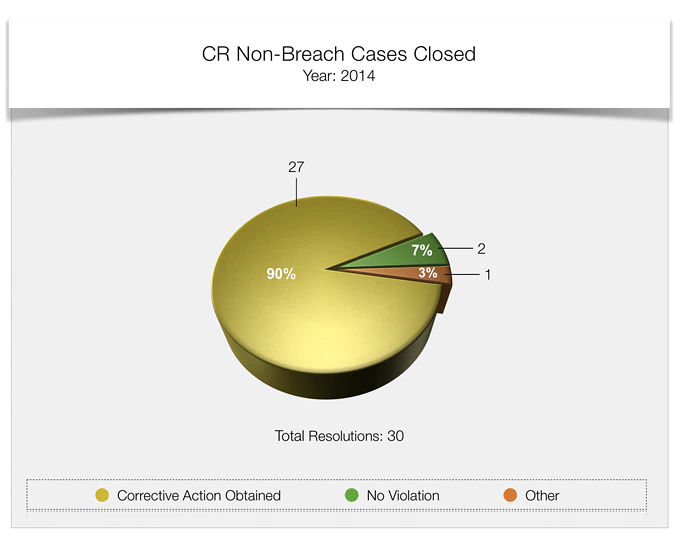
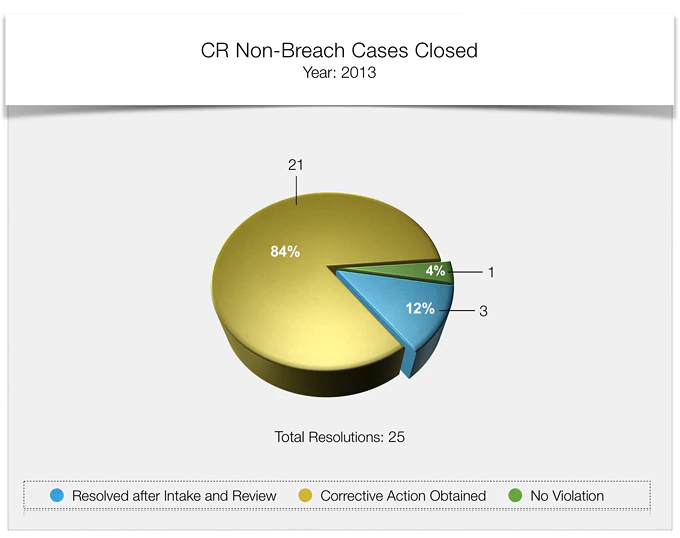
Non-Breach Compliance Reviews
This page shows the enforcement results by calendar year according to the type of closure, which includes the percentage of the total resolutions for each category. This represents the number of compliance reviews that OCR has resolved.
|
YEAR |
INVESTIGATED: NO VIOLATION |
INVESTIGATED: CORRECTIVE ACTION OBTAINED |
RESOLVED AFTER INTAKE AND REVIEW |
OTHER |
TOTAL RESOLUTIONS |
||||
|---|---|---|---|---|---|---|---|---|---|
|
2013 |
1 |
4% |
21 |
84% |
3 |
12% |
0 |
0% |
25 |
|
2014 |
2 |
7% |
27 |
90% |
0 |
0% |
1 |
3% |
30 |
|
2015 |
7 |
19% |
24 |
67% |
2 |
6% |
3 |
8% |
36 |
Enforcement Results, Pie Chart by Year
- January 1, 2015 - December 31, 2015
- January 1, 2014 - December 31, 2014
- January 1, 2013 - December 31, 2013

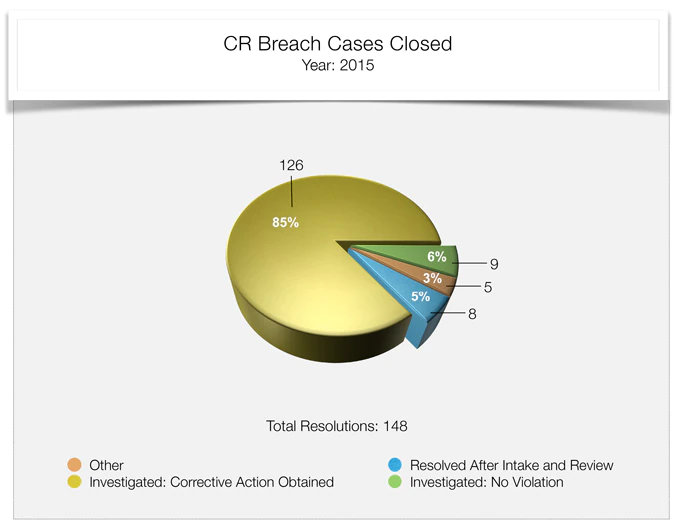
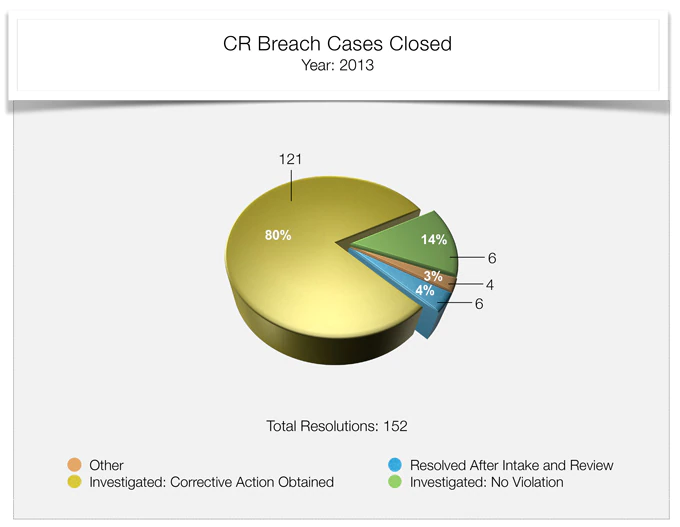
Yearly Enforcement Results – Breach Compliance Reviews
The pie graph shows the enforcement results by calendar year according to the type of closure for 2015. The closure categories are:
- Resolved after Intake and Review;
- Investigated: No Violation;
- Investigated: Corrective Action Obtained;
- Other.
Each category includes the percentage of the total resolutions for 2013. This represents the number of compliance reviews that OCR has resolved.
There were:
|
YEAR |
RESOLVED AFTER INTAKE AND REVIEW |
INVESTIGATED: NO VIOLATION |
INVESTIGATED: CORRECTIVE ACTION OBTAINED |
OTHER |
TOTAL RESOLUTIONS |
||||
|---|---|---|---|---|---|---|---|---|---|
|
2013 |
6 |
4% |
21 |
14% |
121 |
80% |
4 |
3% |
152 |
|
2014 |
7 |
3% |
6 |
3% |
216 |
90% |
10 |
4% |
239 |
|
2015 |
8 |
5% |
9 |
6% |
126 |
85% |
5 |
3% |
148 |
Enforcement Results, Pie Chart by Year
- January 1, 2015 – December 31, 2015
- January 1, 2014 – December 31, 2014
- January 1, 2013 – December 31, 2013