(As of January 31, 2013)
Topics on this page:
Image
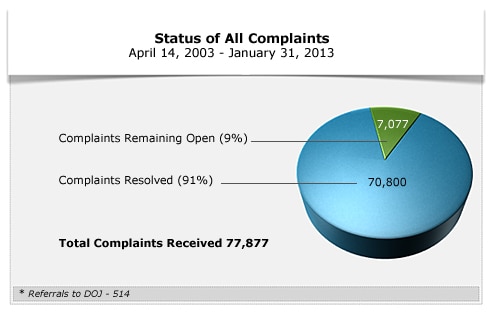
| Status of All Complaints | ||
|---|---|---|
| Complaints Remaining Open | 7,077 | 9% of Total |
| Complaints Resolved | 70,800 | 91% of Total |
| Total Complaints Received | 77,877 | |
* Referrals to DOJ - 514
Image
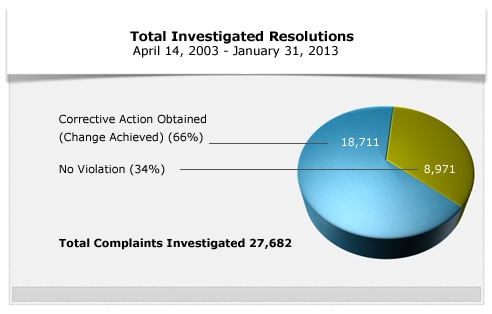
| Total Investigated Resolutions | ||
|---|---|---|
| Corrective Action Obtained (Change Achieved) | 18,711 | 66% of Total |
| No Violation | 8,971 | 34% of Total |
| Total Complaints Investigated | 27,682 |