(As of December 31, 2009)
Topics on this page:
Image
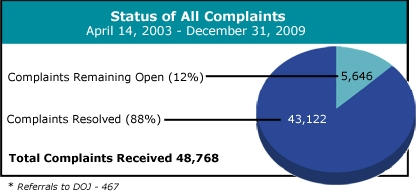
| Status of All Complaints | ||
|---|---|---|
| Complaints Remaining Open | 5,646 | 12% of Total |
| Complaints Resolved | 43,122 | 88% of Total |
| Total Complaints Received | 48,768 | |
* Referrals to DOJ - 466
Image
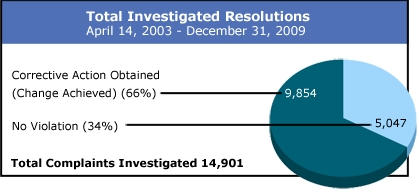
| Total Investigated Resolutions | ||
|---|---|---|
| Corrective Action Obtained (Change Achieved) | 9,854 | 66% of Total |
| No Violation | 5,047 | 34% of Total |
| Total Complaints Investigated | 14,901 |
Image