

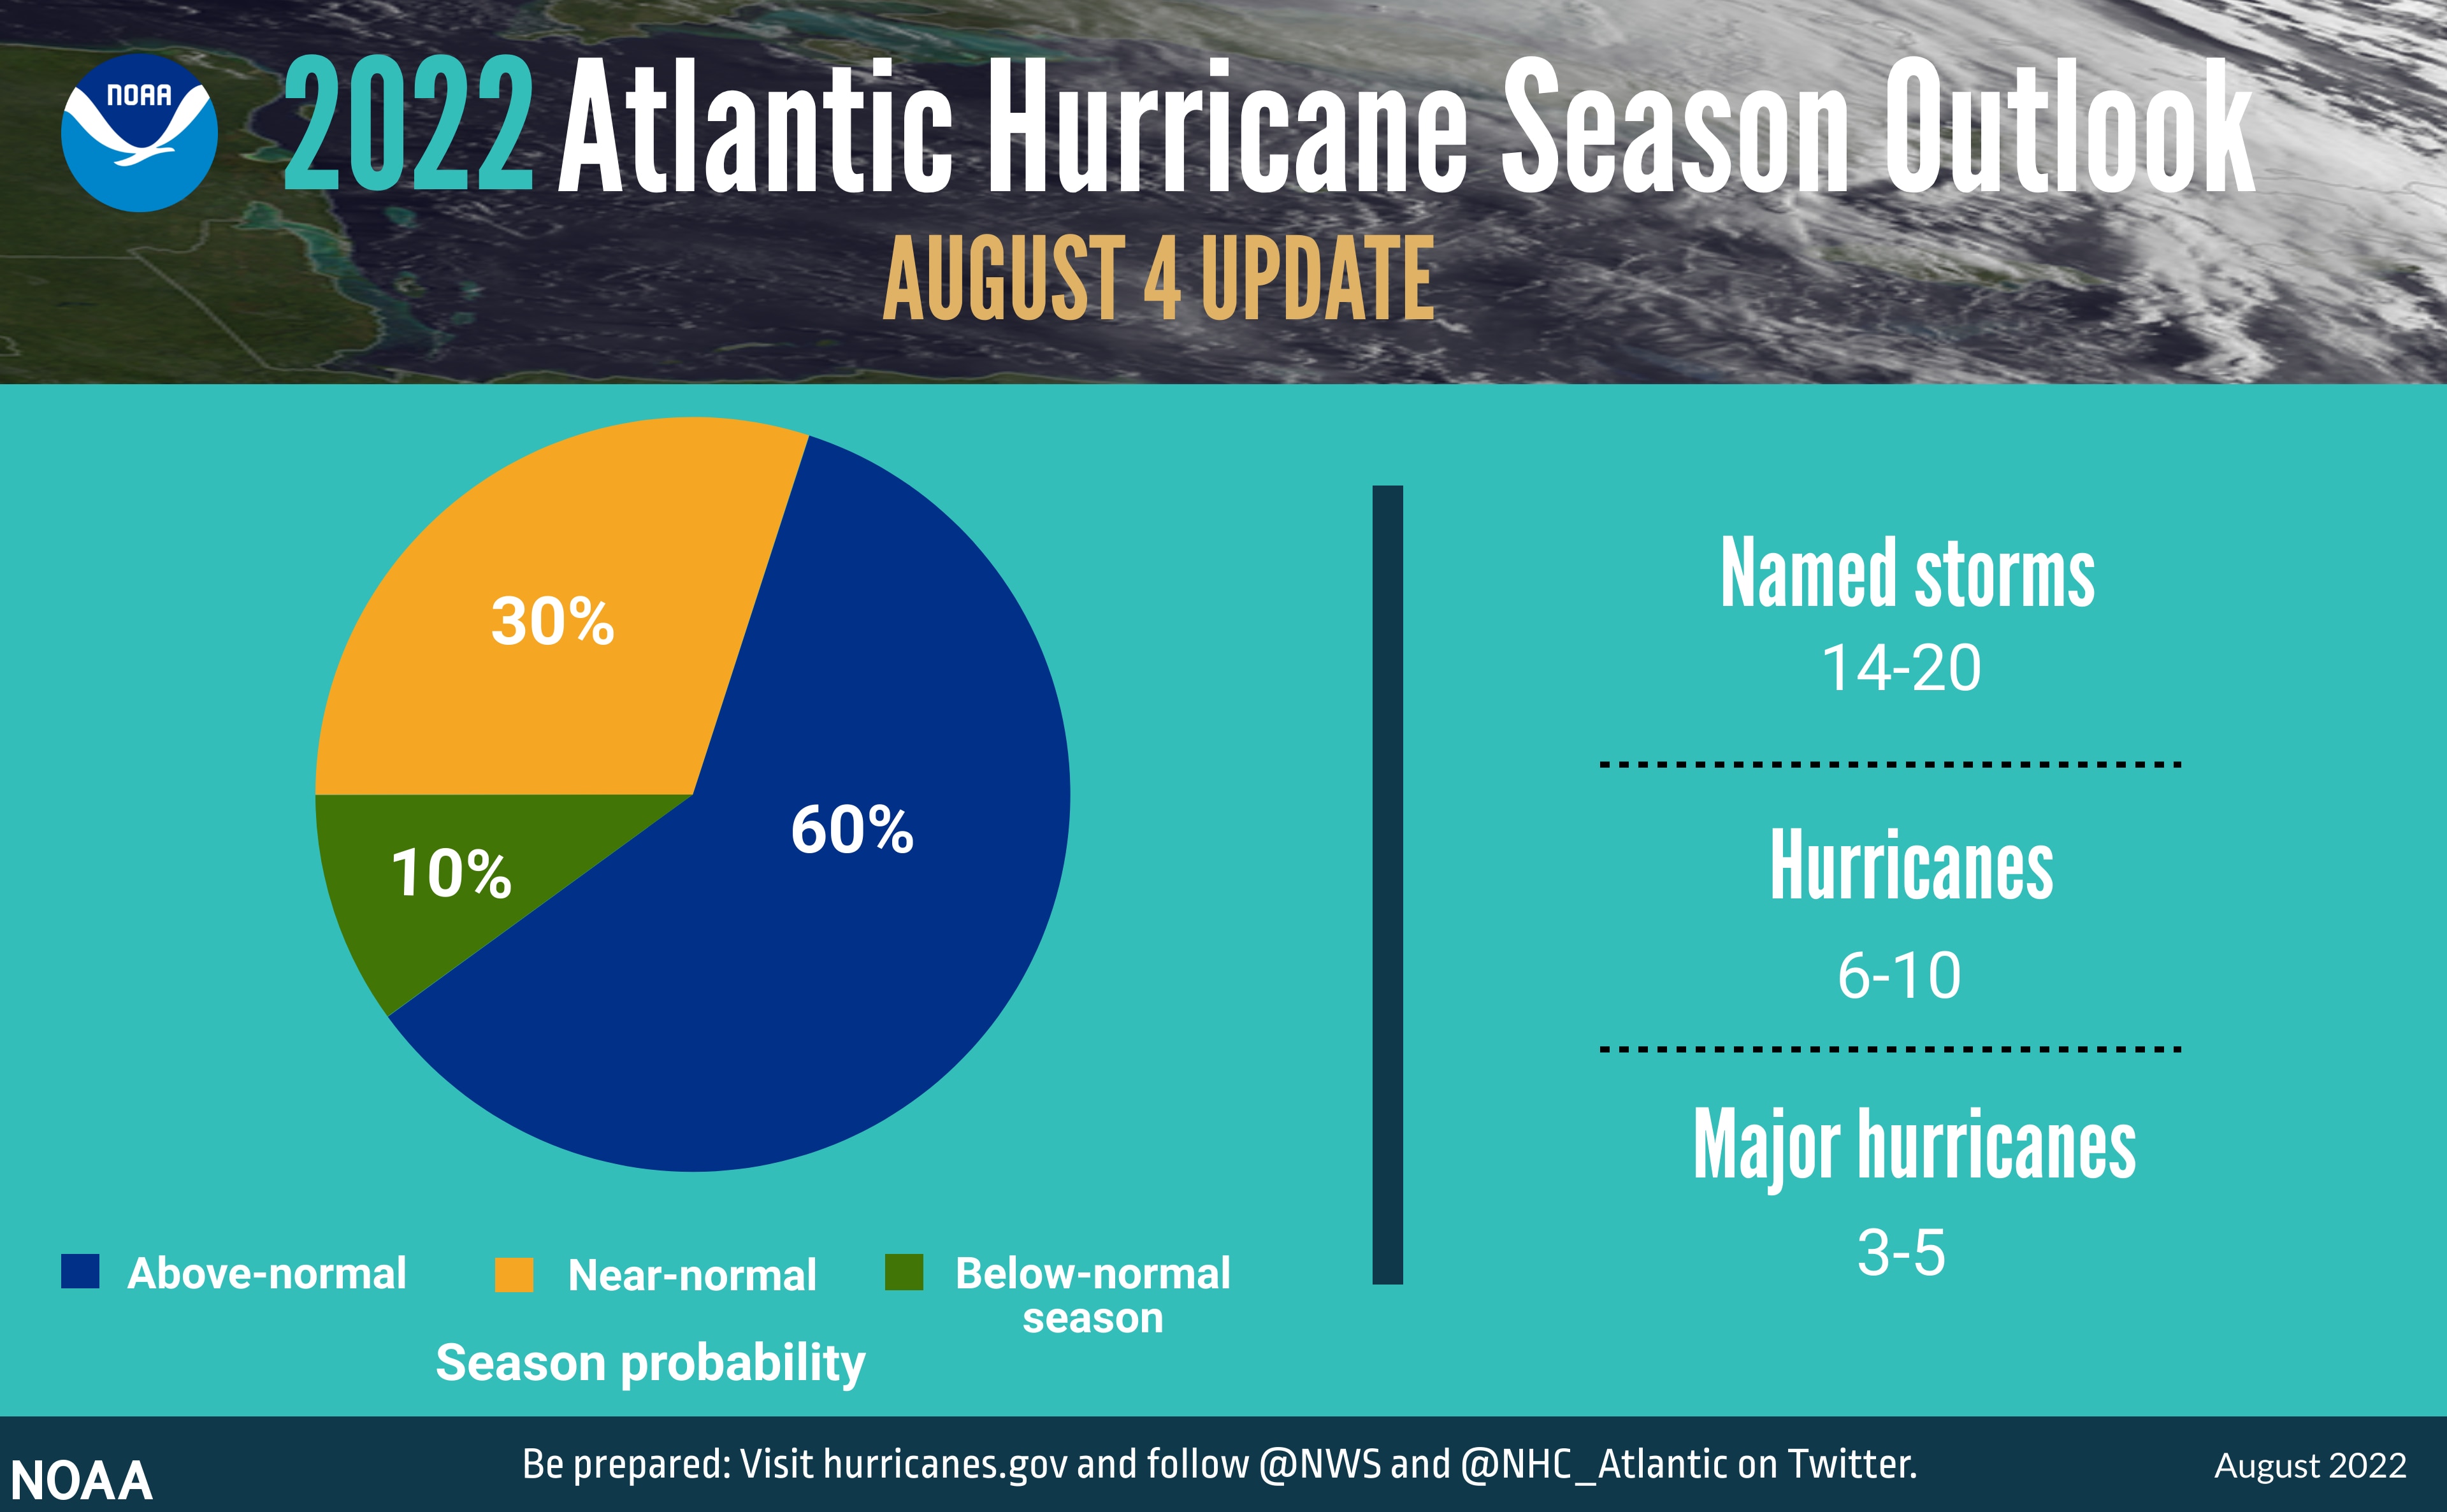
In August, the National Oceanic and Atmospheric Administration (NOAA) Climate Prediction Center slightly decreased the likelihood of an above-normal Atlantic hurricane season to 60% (lowered from the outlook issued in May, which predicted a 65% chance). NOAA’s outlook calls for 14-20 named storms (winds of 39 mph or greater), of which 6-10 could become hurricanes (winds of 74 mph or greater). Of those, 3-5 could become major hurricanes (winds of 111 mph or greater). So far, the season has seen three named storms and no hurricanes in the Atlantic Basin. In past years including 2021, July lulls have sometimes been followed by very active periods in August and September. An average hurricane season produces 14 named storms, of which 7 become hurricanes, including 3 major hurricanes. The Central Pacific, which includes Hawaii, is forecasted to have a below normal season. On average, the Central Pacific experiences about 1.5 hurricanes per year.
Hurricanes Affect Health in Many Ways
Hurricanes increase the risk for a diverse range of health outcomes. For example:
- Flood water poses drowning risks for everyone, including those driving in flood waters. Storm surge historically is the leading cause of hurricane-related deaths in the United States.
- Winds can blow debris—like pieces of broken glass and other objects—at high speeds. Flying debris is the most common cause of injury during a hurricane.
- Open wounds and rashes exposed to flood waters can become infected.
- Using generators improperly can cause carbon monoxide [CO] exposure, which can lead to loss of consciousness and death. Over 400 people die each year from accidental CO poisoning.
- Post-flooding mold presents risks for people with asthma, allergies, or other breathing conditions.
- Power failure during or after hurricanes can harm patients who critically depend on electricity-dependent medical equipment.
Health Impacts From Hurricane Harvey (2017)
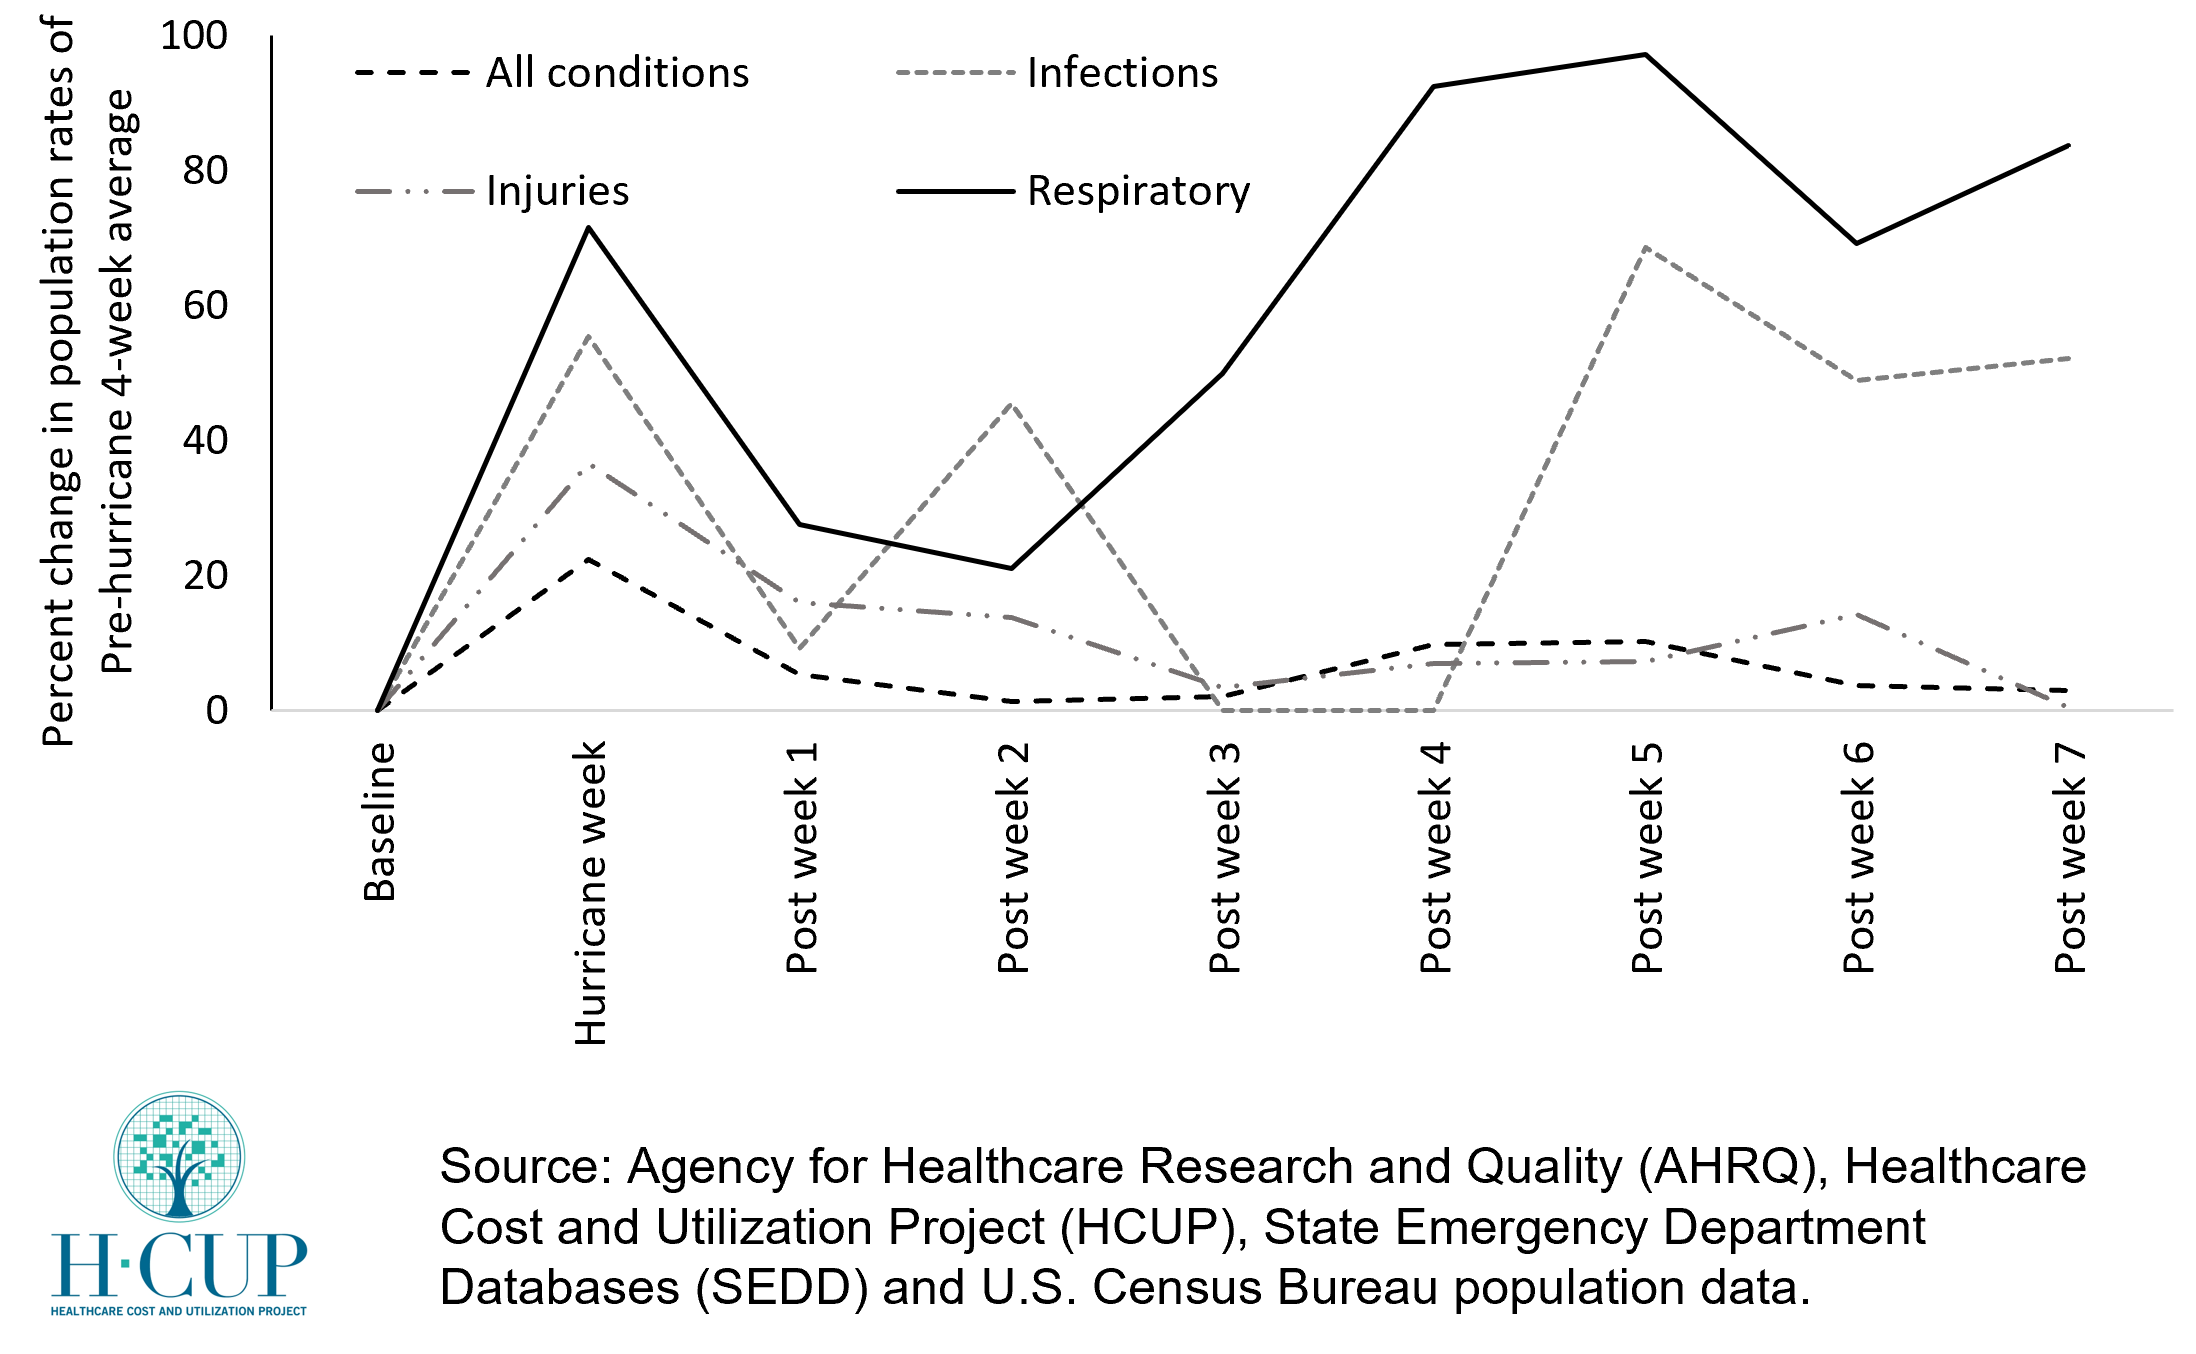
This graph shows the observed changes in the population rates of treat-and-release emergency department (ED) visits following Hurricane Harvey in August 2017. Information on ED utilization is based on data from the AHRQ HCUP State Emergency Department Databases (SEDD). Using information from NOAA and the Federal Emergency Management Agency (FEMA), counties that were in the direct path of the hurricane were identified. For these counties, the percent change in the population rate of treat-and-release ED visits during and post-hurricane were compared to the pre-hurricane average utilization rates. Over a 7-week period after the hurricane, the largest increase in population rates of treat-and-release ED visits were observed for respiratory conditions, with relatively smaller increase for infections, injuries and all conditions.
Which parts of the country are at high risk from hurricanes?
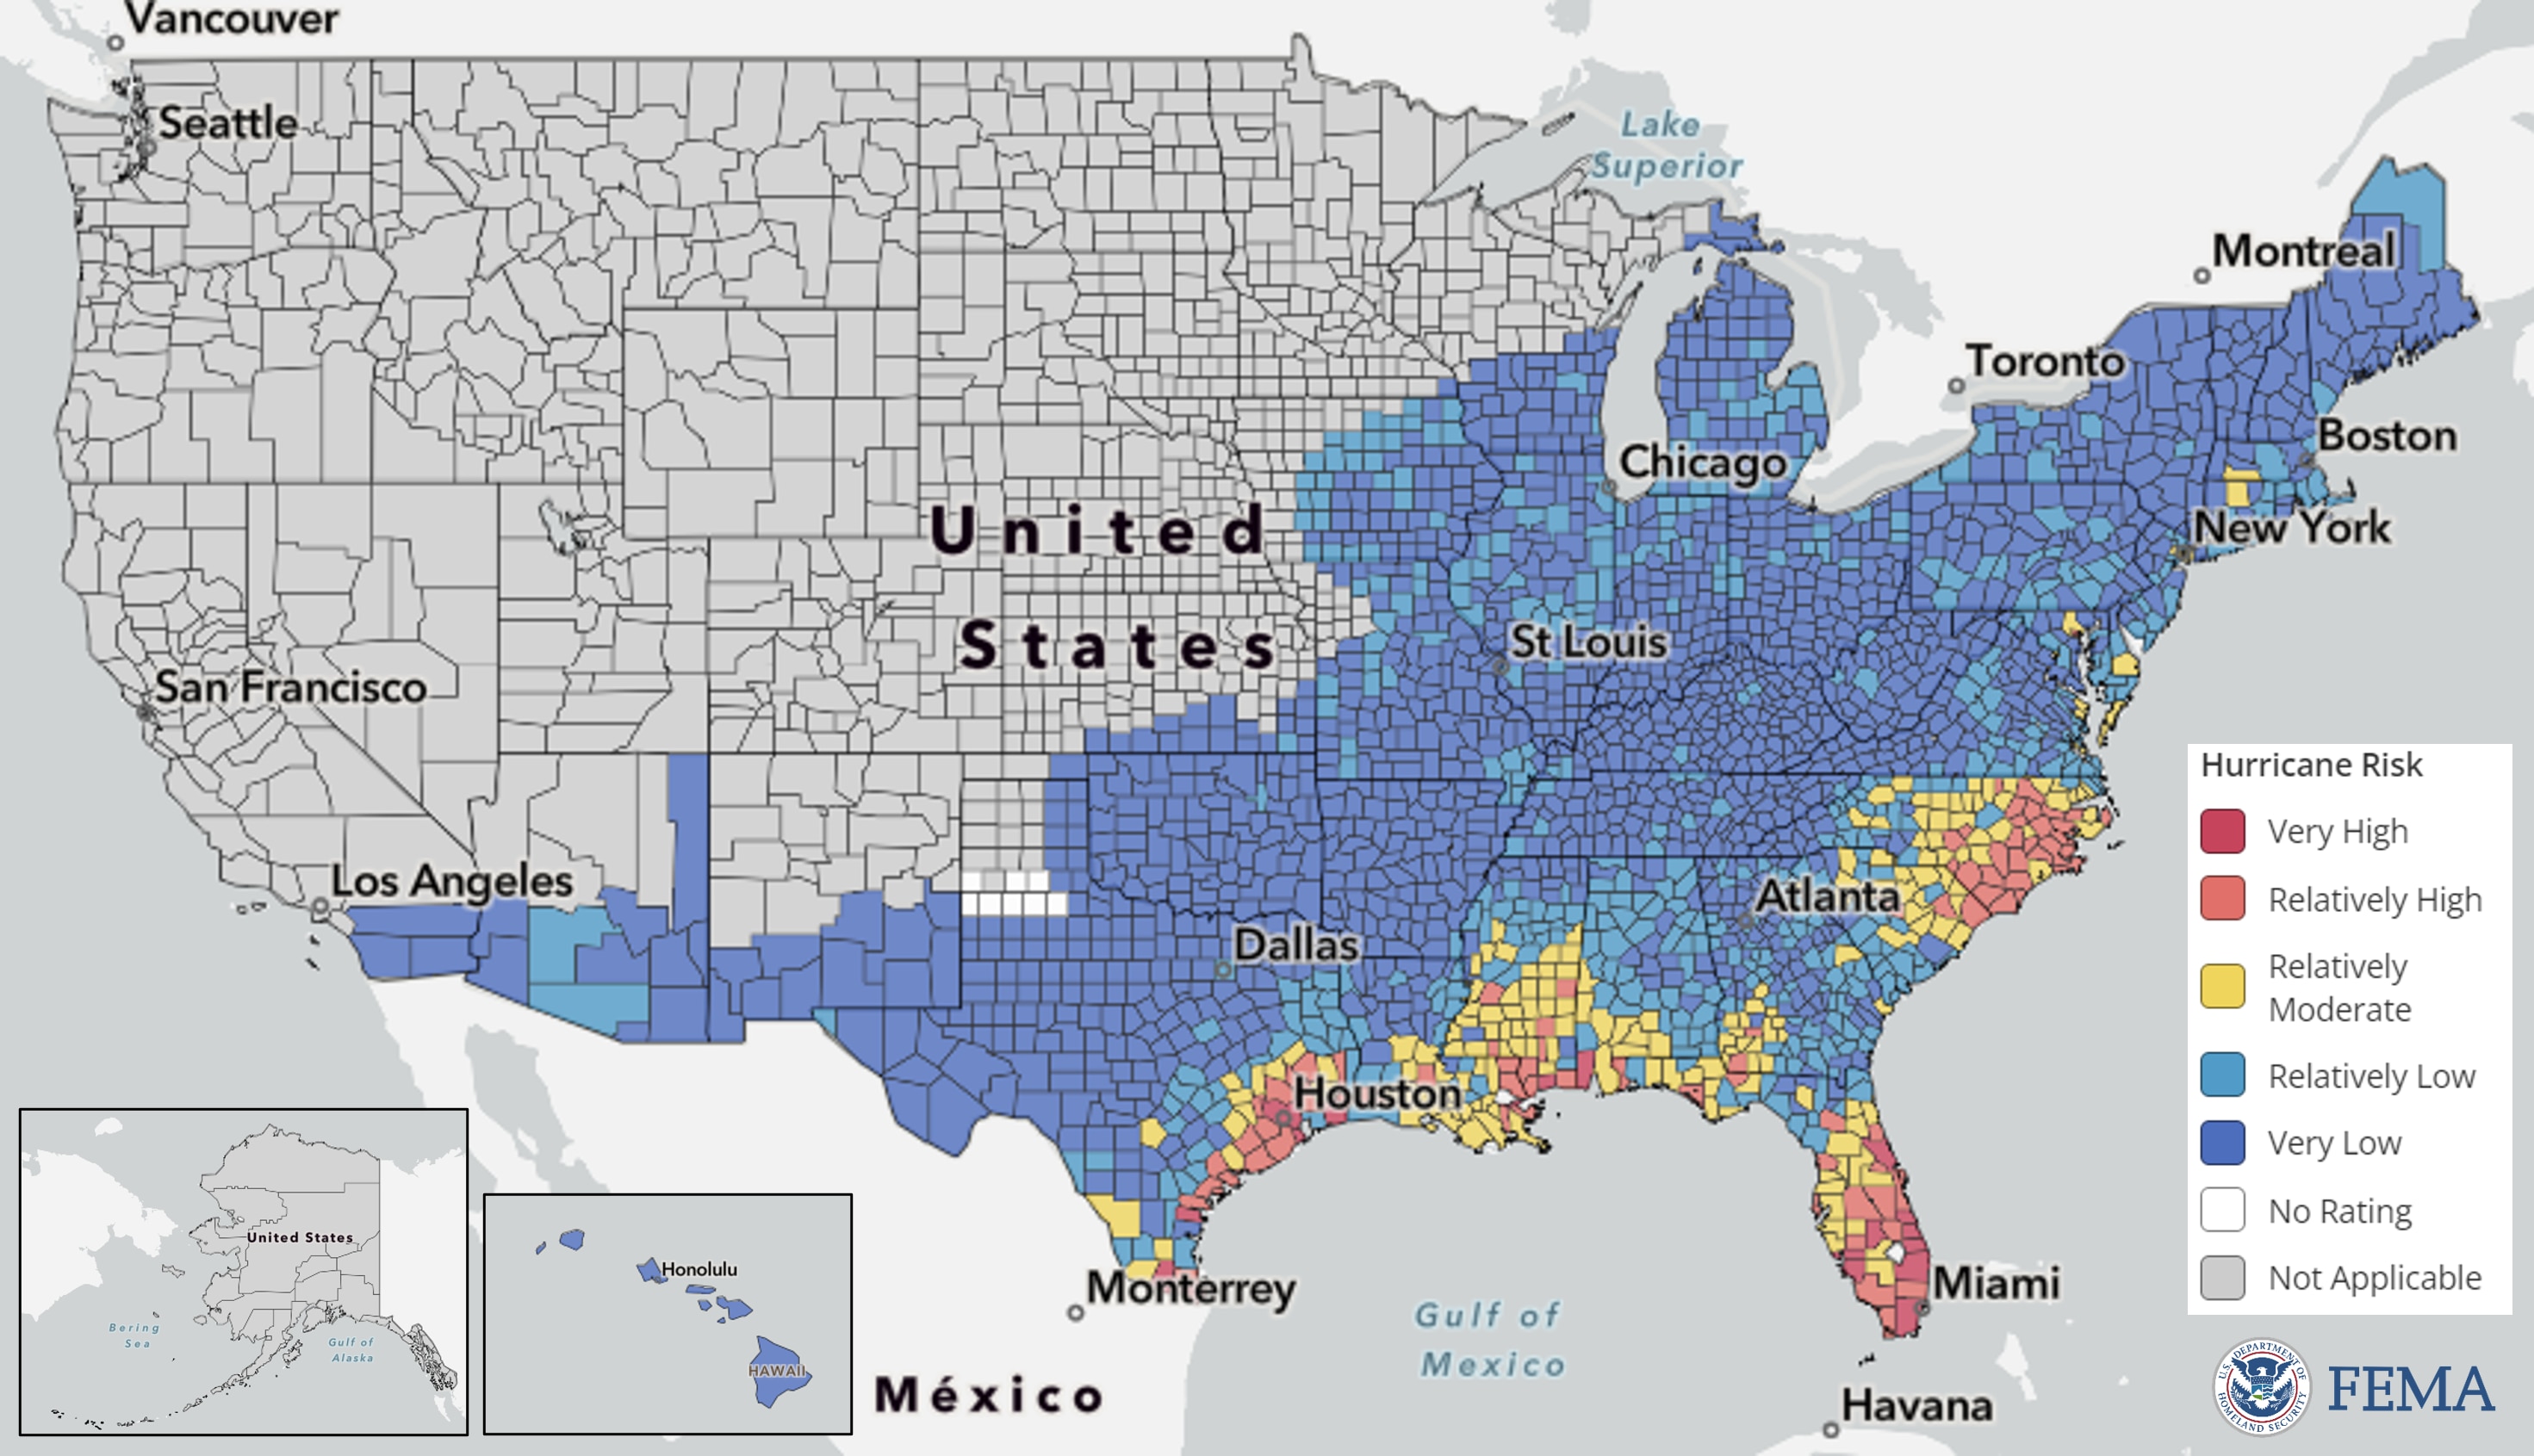
Figure: This map of the United States is colored by the relative Risk Index rating for the Hurricane hazard. The characterization of risk across these counties are based on historical records on hurricane paths and intensity.
The Federal Emergency Management Agency (FEMA) provides information on the risk of different climate hazards across the 50 states and Washington DC through the National Risk Index (NRI) platform. The Risk Index leverages available data for natural hazard and community risk factors to develop a baseline relative risk measurement for each United States county and census tract. 291 counties across 16 states are estimated to have “extremely high,” “relatively high,” or “relatively moderate” hurricane risk. In these counties, the total population at risk is 60,095,904 people.
Who is at high risk from hurricanes in the counties estimated to have “extremely high,” “relatively high,” or “relatively moderate” hurricane risk?
Risk factors vary across the 291 counties identified to have “extremely high,” “relatively high,” and “moderately high” hurricane risk. Of these counties:
49 (17%) have a high number of people aged 65 or over, living alone.
153 (53%) have a high number of people without health insurance.
70 (24%) have a high number of uninsured children.
35 (12%) have a high number of people living in rural areas.
235 (81%) have a high number of Black or African American persons.
118 (41%) have a high number of people with frequent mental distress.
154 (53%) have a high number of people living in poverty.
57 (20%) have a high number of people spending a large proportion of their income on home energy.
157 (54%) have a high number of people with severe housing cost burden.
119 (40%) have a high number of people with electricity-dependent medical equipment and enrolled in the HHS emPOWER program.
150 (52%) have a high number of people in mobile homes.
89 (31%) have a high number of people with one or more disabilities.
178 (61%) are identified as highly vulnerable by CDC’s Social Vulnerability Index.
*“A high number” indicates that these counties are in the top quartile for this indicator compared to other counties
Resources to Reduce Health Risks Associated with Hurricanes
Health risks from hurricanes include drowning due to flood water, injuries, carbon monoxide poisoning after a power outage, infection during evacuation or shelter-in-place, post-storm exposure to mold, and psychological distress.
General Preparedness
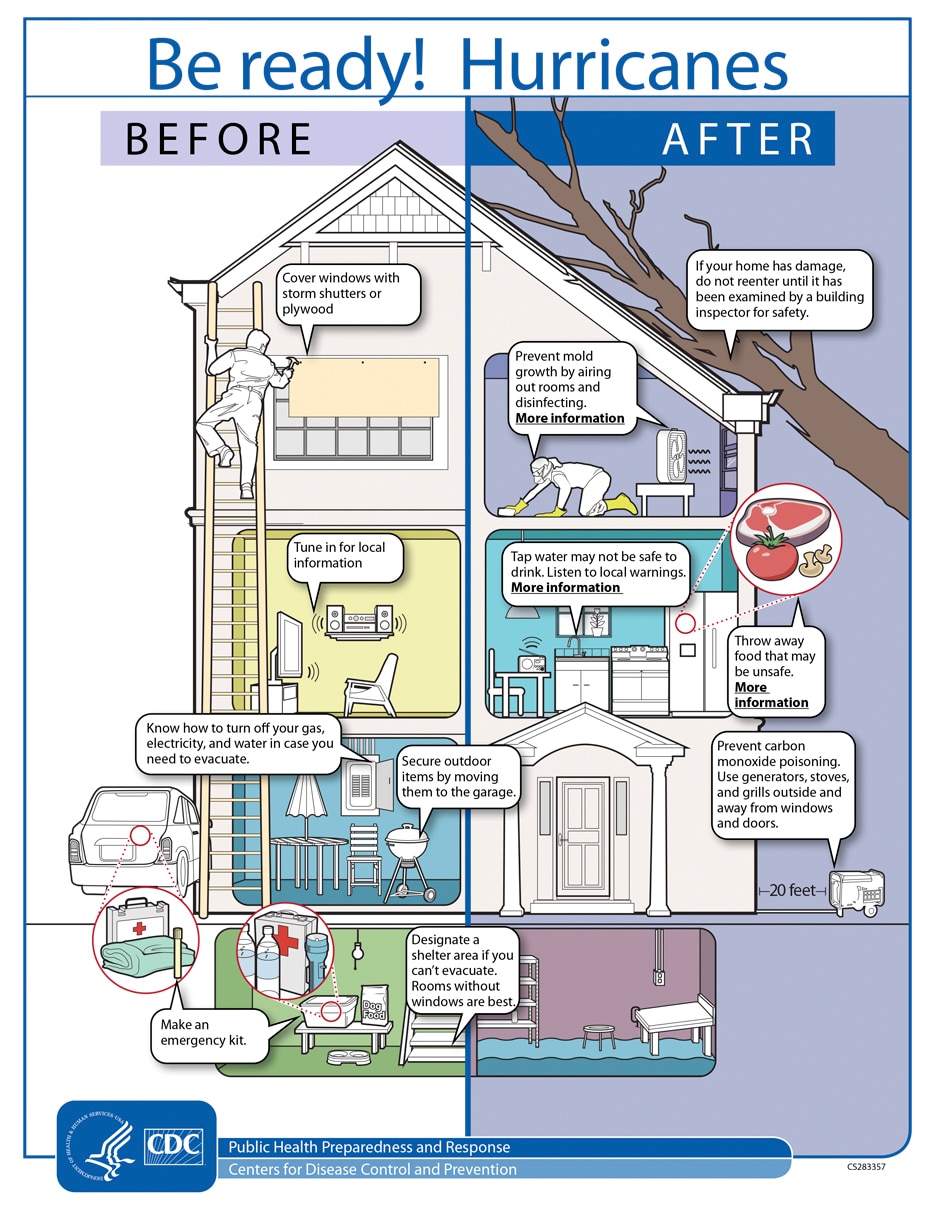
Image source: https://www.cdc.gov/cpr/infographics/br-hurricanes.htm
- Find more resources on hurricane preparedness from the Office of the Assistant Secretary for Preparedness and Response Technical Resources, Assistance Center, and Information Exchange’s (ASPR TRACIE’s) Hurricane Resources at Your Fingertips.
- The Ready.gov Hurricanes site includes information on preparing for hurricanes, staying safe during a storm, and returning home. The Ready Business site also includes a hurricane toolkit for business preparedness.
- The CDC’s Hurricanes and Other Tropical Storms site provides resources to help individuals be prepared for hurricanes and be safe after a hurricane as well as for professionals and response workers.
- The U.S. Food and Drug Administration's Hurricanes: Health and Safety site covers multiple topics to help consumers, industry stakeholders and medical providers prepare for hurricanes, including food and drug safety and using medical devices.
- If you do not have health insurance and are in a federally-identified disaster, the Emergency Prescription Assistance Program can help you get the prescription drugs, vaccinations, medical supplies, and equipment that they need.
- If you have Medicare and your medical device is damaged or lost due to an emergency or disaster, Medicare may cover the cost to repair or replace your equipment or supplies.
- You can locate and access your electronic health records from a variety of sources by using the U.S. Department of Health and Human Services' online tool.
- After natural disasters such as hurricanes, tornadoes, and floods, excess moisture and standing water contribute to the growth of mold in homes and other buildings. The Centers for Disease Control and Prevention’s (CDC) Mold After a Disaster includes information about who is at greatest risk from mold, the health effects of mold, and preventing mold growth.
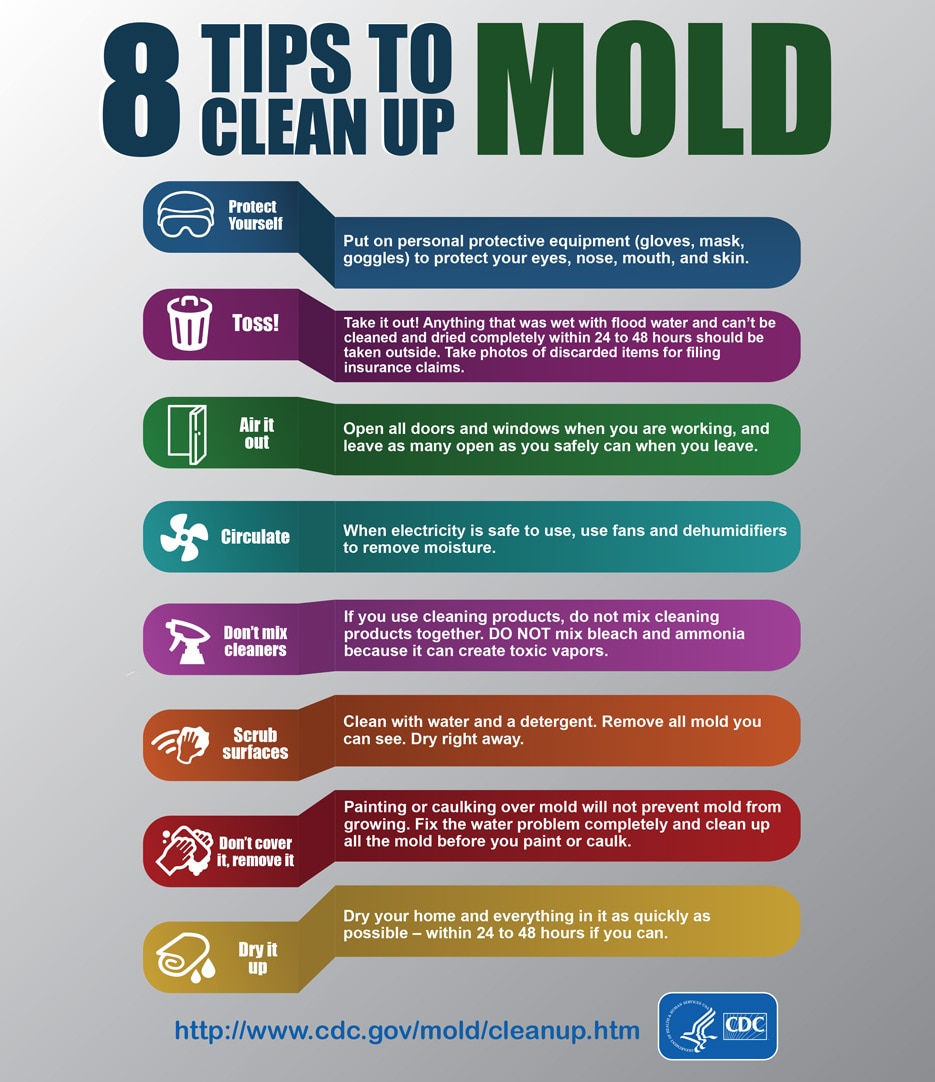
Image source: https://www.cdc.gov/disasters/mold/index.html
Mental Health
It’s normal for hurricanes and other extreme weather events to cause people to experience emotional distress. Feelings such as overwhelming anxiety, constant worrying, trouble sleeping, and other depression-like symptoms are common responses before, during, and after these types of storms. The Substance Abuse and Mental Health Services Administration Helpline and Text Service is available 24/7, free, and staffed by trained crisis counselors. Call or text 1-800-985-5990 to get help and support for any distress that you or someone you care about may be feeling related to any disaster.
Learn more about hurricanes and mental health at the SAMHSA’s Hurricanes and Tropical Storms site. SAMHSA also has other disaster behavioral health resources, including newsletters and tip sheets. ASPR TRACIE’s Disaster Behavioral Health Resources includes information about services for at-risk populations following a disaster.
Check out SAMHSA’s newly launched Climate Change and Health Equity site for more information on the behavioral health impacts of climate change, preparing for a disaster, and resources for disaster planning and climate change education.
Best Practices for Emergency Managers
- ASPR TRACIE’s Major Hurricanes: Potential Health and Medical Implications provides a short overview of the potential significant health and medical response and recovery needs facing hurricane- and severe storm-affected areas, based on past experience and lessons learned from Hurricanes Katrina, Sandy, Harvey, Maria, and others. The HHS emPOWER collects and shares de-identified Medicare data to help response agencies take action to protect the health of Medicare beneficiaries who depend on vulnerable electrical medical equipment.
- The CDC’s Emergency Responder Health Monitoring and Surveillance™ (ERHMSTM) framework provides recommendations for protecting emergency responders during small and large emergencies in any setting.
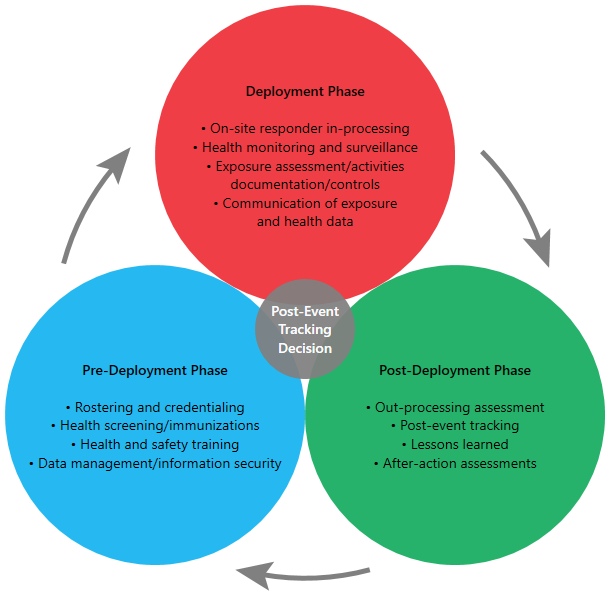
Image source: https://www.cdc.gov/niosh/erhms/default.html
- The SAMHSA Disaster Technical Assistance Center Supplemental Research Bulletin, Greater Impact: How Disasters Affect People of Low Socioeconomic Status, is designed to help disaster behavioral health professionals inform their disaster behavioral health planning for low socioeconomic status populations. SAMHSA also has developed a handbook to support disaster planning by behavioral health programs.
- The Agency for Healthcare Research and Quality’s Hospital Evacuation Decision Guidefocuses on post-event evacuations.
- ASPR TRACIE’s After the Flood: Mold-Specific Resources collects public messages, fact sheets, checklists, guidance documents, and other educational resources related to mold. They include pre-scripted (and, in some cases, already recorded) PSAs, as they are tangible and ready to implement examples of risk communication materials that can essentially be used immediately.
- The Department of Education offers tools and resources for schools and educational institutions as they manage safety, security, and emergency management programs.
Additional Resources for Public Health Safety During Hurricanes
Hurricanes can cause power outages that make it impossible to cool your home and refrigerate food. Hurricane Ida caused at least 1.2 million electricity customers to lose power. In addition, disasters like hurricanes that strike during the COVID-19 pandemic can further stress the health and medical system and threaten vulnerable residents and infrastructure.
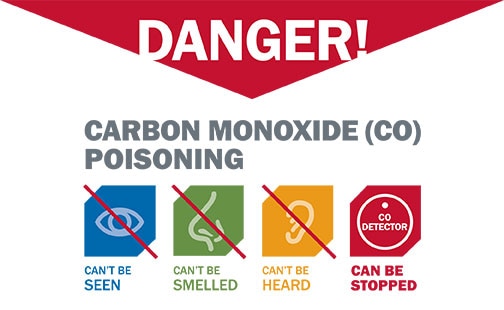
Image source: https://www.cdc.gov/co/pdfs/Flyer_Danger.pdf
- The CDC has information about What You Need to Know When the Power Goes Out Unexpectedly. To prevent carbon monoxide poisoning, use generators, pressure washers, grills, and similar items outdoors only. Generators should be used at least 20 feet away from your home.
- The CDC’s Going to a Public Disaster Shelter During the COVID-19 Pandemic provides guidance on measures to reduce the possible spread of COVID-19 among people who seek safety in a disaster shelter during severe weather events.
- Considerations for healthcare and emergency management professionals when planning for all-hazard secondary disasters during a public health emergency are available from ASPR TRACIE.
- The Federal Emergency Management Agency’s (FEMA) Exercise Starter Kit for Preparedness in a Pandemic offers ready-to-use materials and templates to your own planning workshop on preparedness in a pandemic. FEMA also offers Mass Care/Emergency Assistance Pandemic Planning Considerations For State, Local, Tribal, Territorial and Non-Government Organizational Planners, Providers and Support Agencies.
- See the Extreme Heat resources section for information on preventing heat-related illness.