

Welcome to the third edition of the Climate and Health Outlook from the Department of Health and Human Services (HHS) Office of Climate Change and Health Equity (OCCHE). The Climate and Health Outlook is an effort to inform health professionals and the public on how our health may be affected in the coming month(s) by climate events and provide resources to take proactive action. This edition expands beyond extreme heat to include additional climate-related health hazards.
Download the Climate and Health Outlook for July 2022
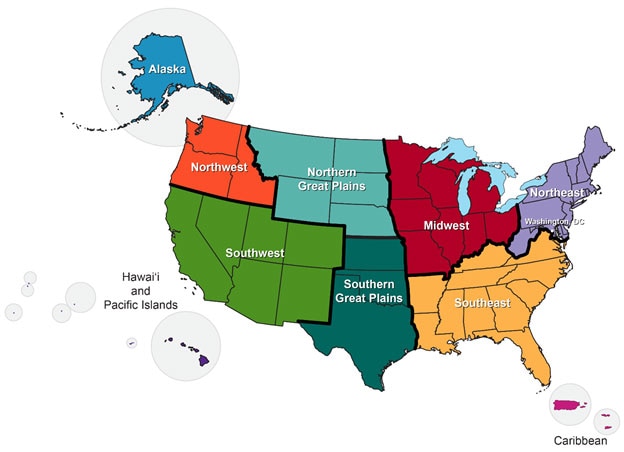
Image source: https://scenarios.globalchange.gov/regions_nca4
U.S. Seasonal Forecast for Health: July 2022
Regional health forecasts for heat, wildfire, drought, and hurricanes
Alaska: Moderate drought coverage recently expanded across Alaska and is favored to persist. A month of hot and dry weather across much of the state has led to extremely dry fuels across the landscape. Above-normal wildland fire* potential projected for much of southern and central Alaska.
Northwest: Counties in Idaho (15), Oregon (6), and Washington (3) are projected to have more than 5 heat exceedance days in July, 2022. Greater than 25% of the Northwest - primarily southern Oregon and Idaho - is in moderate to exceptional drought and expected to persist. Above-normal wildland fire* potential projected for parts of eastern Washington and Oregon.
Southwest: Counties in Colorado (26), Utah (23), Arizona (15) New Mexico (15), Nevada (13), and California (10) are projected to have more than 5 heat exceedance days in July, 2022. A dry climatology precludes any prospects for drought improvements, except across the lower Four Corners region where an anticipated robust Monsoon season may yield some drought improvements. Above-normal wildland fire* potential projected for much of northern California and Nevada.
Hawai’i and Pacific Islands: The Central Pacific is projected to have a below-average hurricane season. On average, the Central Pacific experiences about 1.5 hurricanes per year. Across Hawai’i, a strong dry signal throughout the period supports drought expansion. Above-normal wildland fire* potential projected for Hawai’i.
Northern Great Plains: Counties in Nebraska (9), Wyoming (9), Montana (6), and South Dakota (3) are projected to have more than 5 heat exceedance days in July, 2022. Drought is expected to persist in Montana and Wyoming while also slightly expanding in South Dakota and Nebraska.
Southern Great Plains: Counties in Texas (122), Kansas (37), and Oklahoma (36) are projected to have more than 5 heat exceedance days in July, 2022. Existing moderate to exceptional drought in Kansas, Oklahoma, and Texas is expected to persist and slightly expand with the exception along the western Gulf Coast where a tropical disturbance will bring locally heavy rainfall, potentially ameliorating drought across southeastern Texas. Above-normal wildland fire* potential projected for northern and central Texas and western Oklahoma.
Midwest: Counties in Missouri (5) are projected to have more than 5 heat exceedance days in July, 2022. Soil moisture has decreased considerably across the Mississippi Valley and central Corn Belt, increasing vulnerability to short term rapid drought, or flash drought, development during July.
Southeast: The Atlantic basin is forecasted to have an above-average hurricane season with 14 – 21 named storms with winds of 39 mph or higher, with 6 –10 of those possibly becoming hurricanes with winds of 74 mph or higher, and 3 – 6 possibly becoming major hurricanes with winds of 111 mph or higher. Counties in Georgia (29), South Carolina (16), Virginia (14), North Carolina (11), Alabama (9), Arkansas (9), Kentucky (2), Louisiana (2), Mississippi (1), Florida (1), and Tennessee (1) are projected to have more than 5 heat exceedance days in July, 2022. Drought conditions are projected to improve with the exception of the lower Mississippi Valley, where drought is expected to persist. Above-normal wildland fire* potential projected for coastal regions in North Carolina, South Carolina, Georgia, and Florida.
Northeast: Counties in Pennsylvania (10), West Virginia (7), and Maryland (3) are projected to have more than 5 heat exceedance days in July, 2022.
Caribbean: The Atlantic basin is forecasted to have an above-average hurricane season with 14 – 21 named storms with winds of 39 mph or higher, with 6 –10 of those possibly becoming hurricanes with winds of 74 mph or higher, and 3 – 6 possibly becoming major hurricanes with winds of 111 mph or higher.
*Smoke from wildfires can impact health hundreds of miles from site of the fire.
For additional information please visit:
- Centers for Disease Control and Prevention Heat and Health Tracker
- National Oceanic and Atmospheric Administration (NOAA) National Hurricane Center and Central Pacific Hurricane Center
- NOAA National Integrated Drought Information System
- NOAA National Weather Service Climate Prediction Center
- National Interagency Fire Center Predictive Services
Outlook for the 2022 Hurricane season
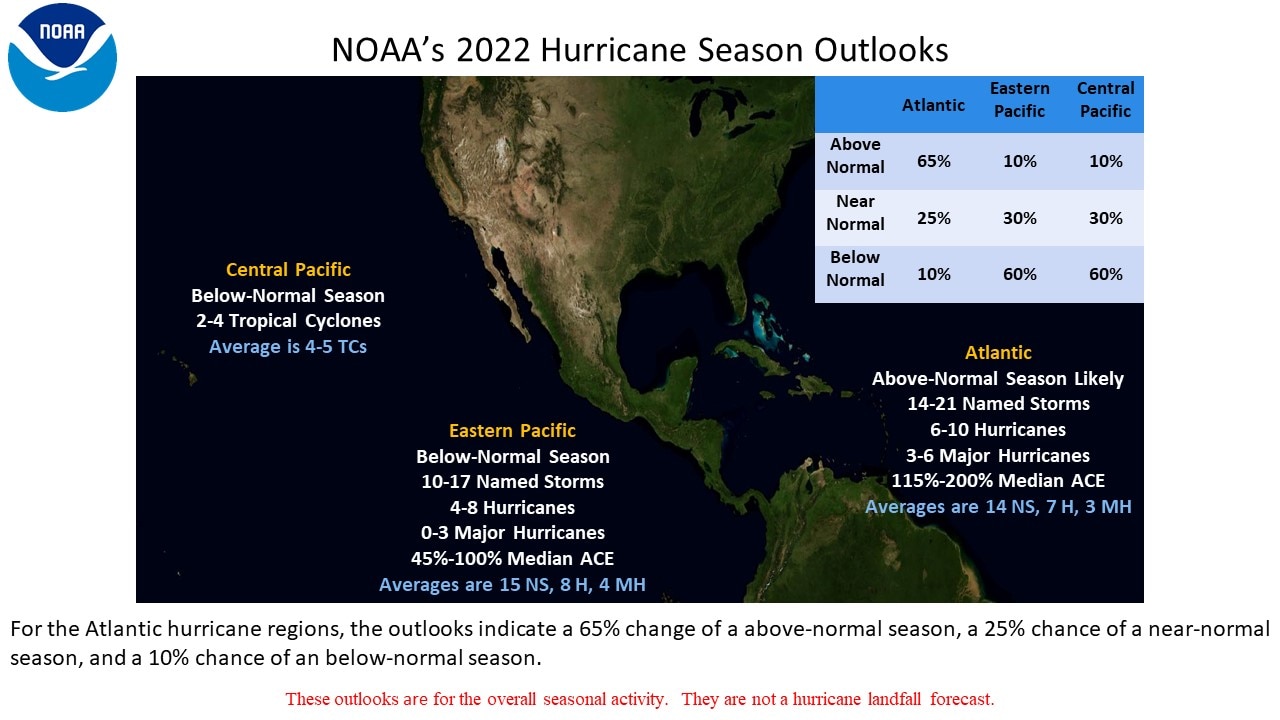
2022 is predicted to be an above-average hurricane season in the Atlantic basin, which includes the Atlantic Ocean, Caribbean Sea, and Gulf of Mexico. According to the forecast, this will be the seventh above-average season in a row. The National Oceanic and Atmospheric Administration (NOAA) Climate Prediction Center’s forecast calls for 14 – 21 named storms with sustained winds of 39 mph or higher, with 6 – 10 of those possibly becoming hurricanes with winds of 74 mph or higher, and 3 – 6 possibly becoming major hurricanes with winds of 111 mph or higher. These ranges of named storms, hurricanes, and major hurricanes are among the highest forecasted over the last decade. The 30-year averages for the Atlantic basin (1991-2020) are 14 named storms, 7 hurricanes and 3 major hurricanes. By contrast, the Central Pacific, which includes Hawaii, is forecasted to have a below normal season. On average, the Central Pacific experiences about 1.5 hurricanes per year.
Hurricanes Affect Health in Many Ways
Hurricanes increase the risk for a diverse range of health outcomes. For example:
- Flood water poses drowning risks for everyone, including those driving in flood waters. Storm surge historically is the leading cause of hurricane-related deaths in the United States.
- Winds can blow debris—like pieces of broken glass and other objects—at high speeds. Flying debris is the most common cause of injury during a hurricane.
- Open wounds and rashes exposed to flood waters can become infected.
- Using generators improperly can cause carbon monoxide [CO] exposure, which can lead to loss of consciousness and death. Over 400 people die each year from accidental CO poisoning.
- Post-flooding mold presents risks for people with asthma, allergies, or other breathing conditions.
- Power failure during or after hurricanes can harm patients who critically depend on electricity-dependent medical equipment.
Health Impacts From Hurricane Harvey (2017)
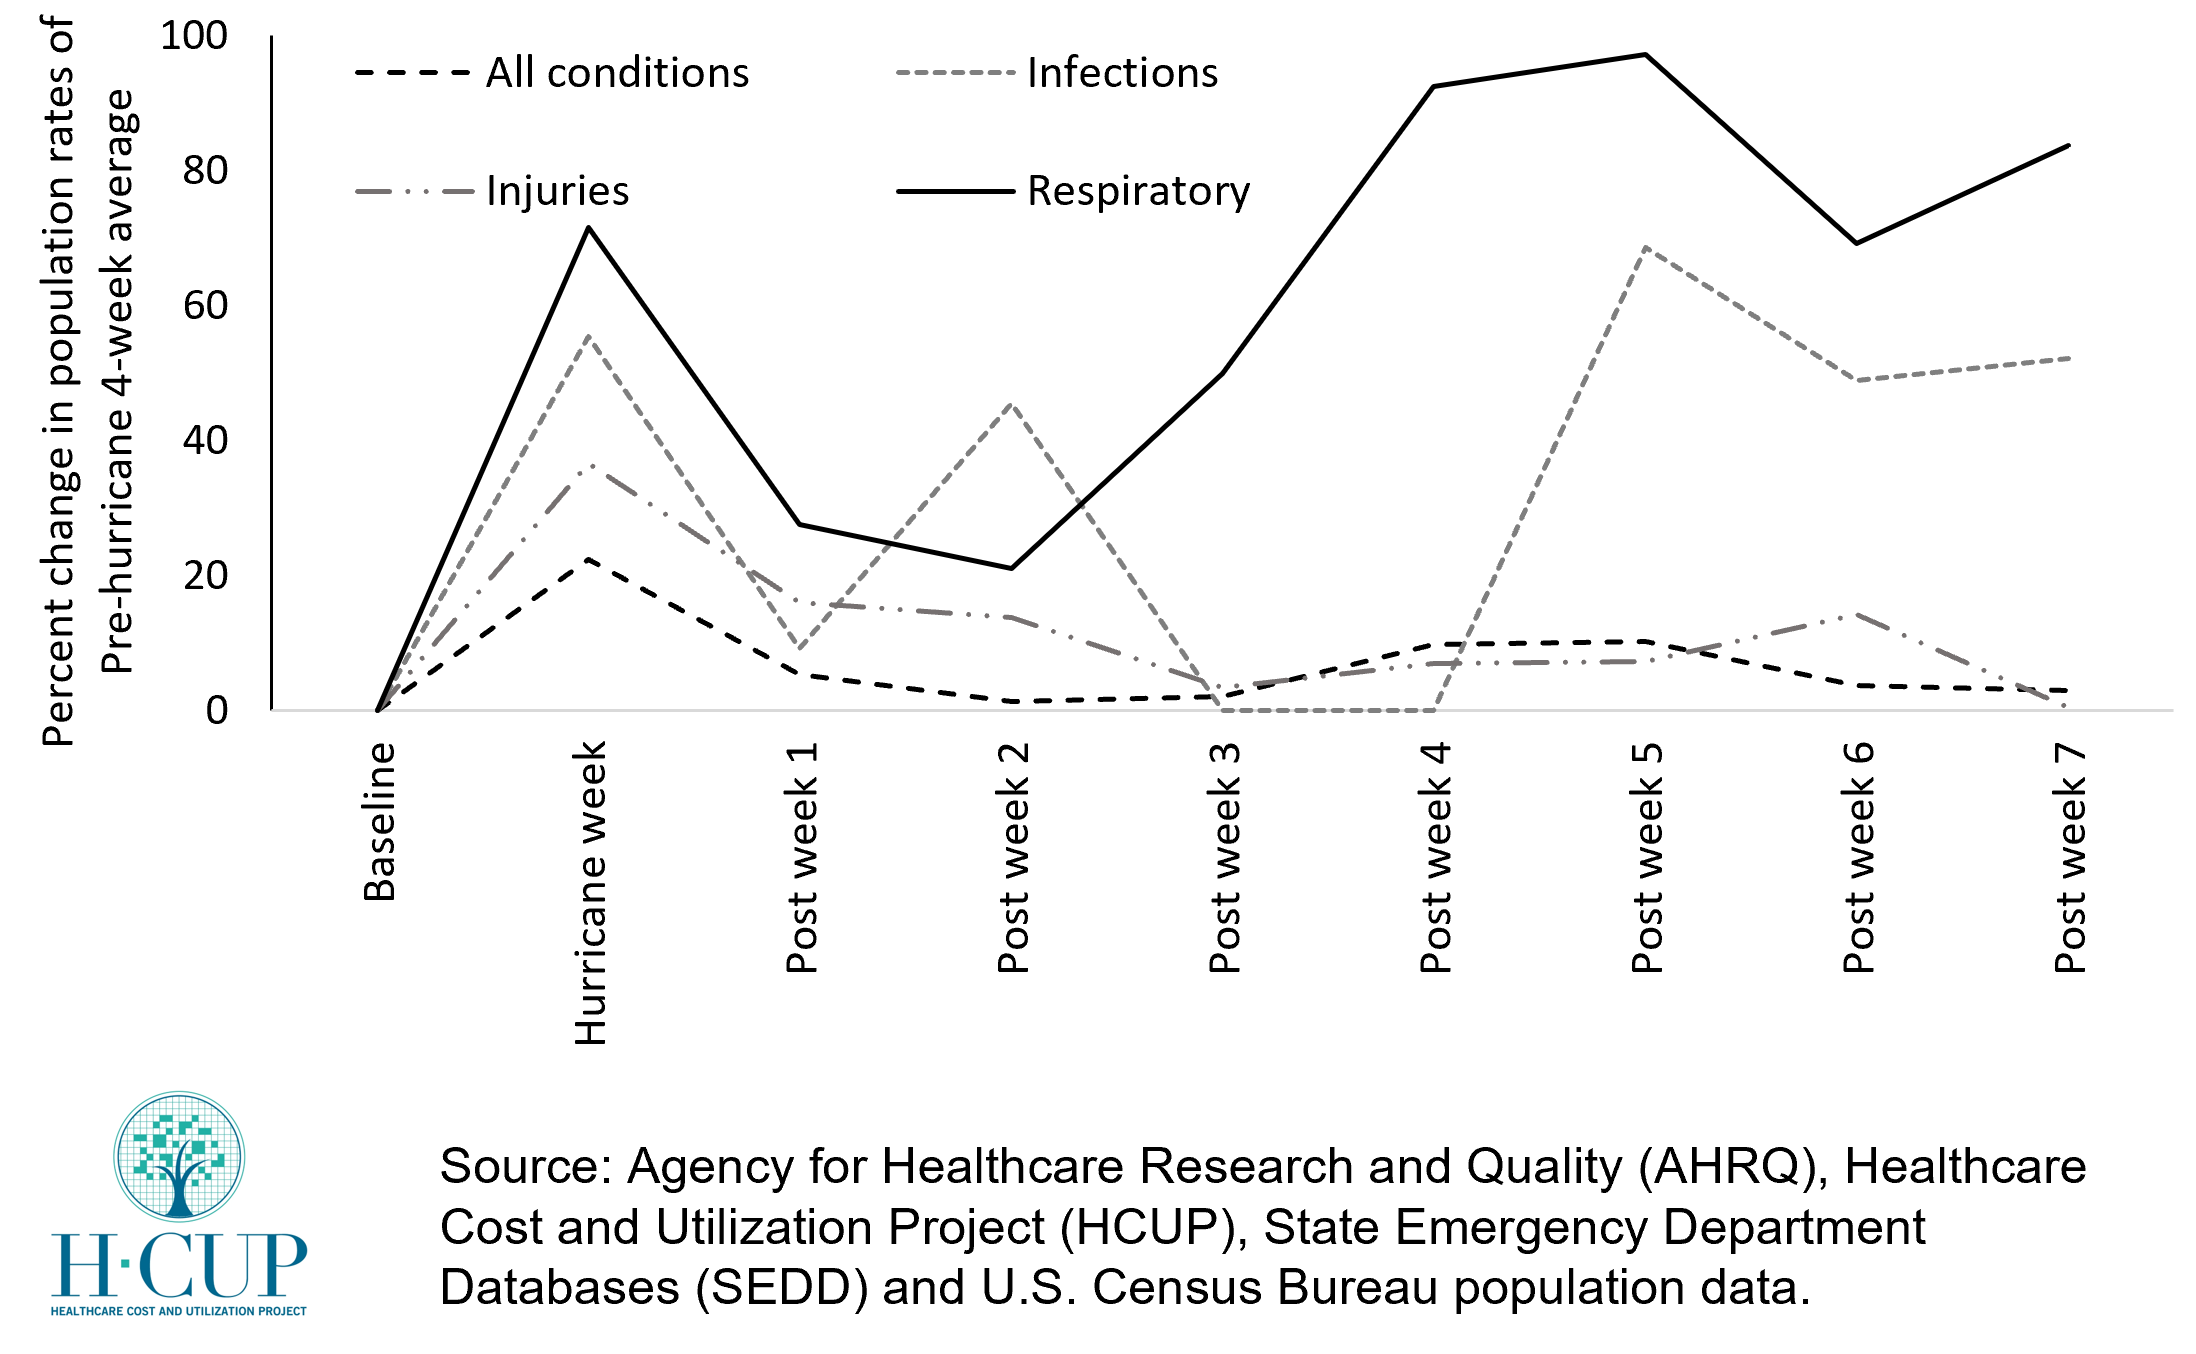
This graph shows the observed changes in the population rates of treat-and-release emergency department (ED) visits following Hurricane Harvey in August 2017. Information on ED utilization is based on data from the AHRQ HCUP State Emergency Department Databases (SEDD). Using information from NOAA and the Federal Emergency Management Agency (FEMA), counties that were in the direct path of the hurricane were identified. For these counties, the percent change in the population rate of treat-and-release ED visits during and post-hurricane were compared to the pre-hurricane average utilization rates. Over a 7-week period after the hurricane, the largest increase in population rates of treat-and-release ED visits were observed for respiratory conditions, with relatively smaller increase for infections, injuries and all conditions.
Which parts of the country are at high risk from hurricanes?
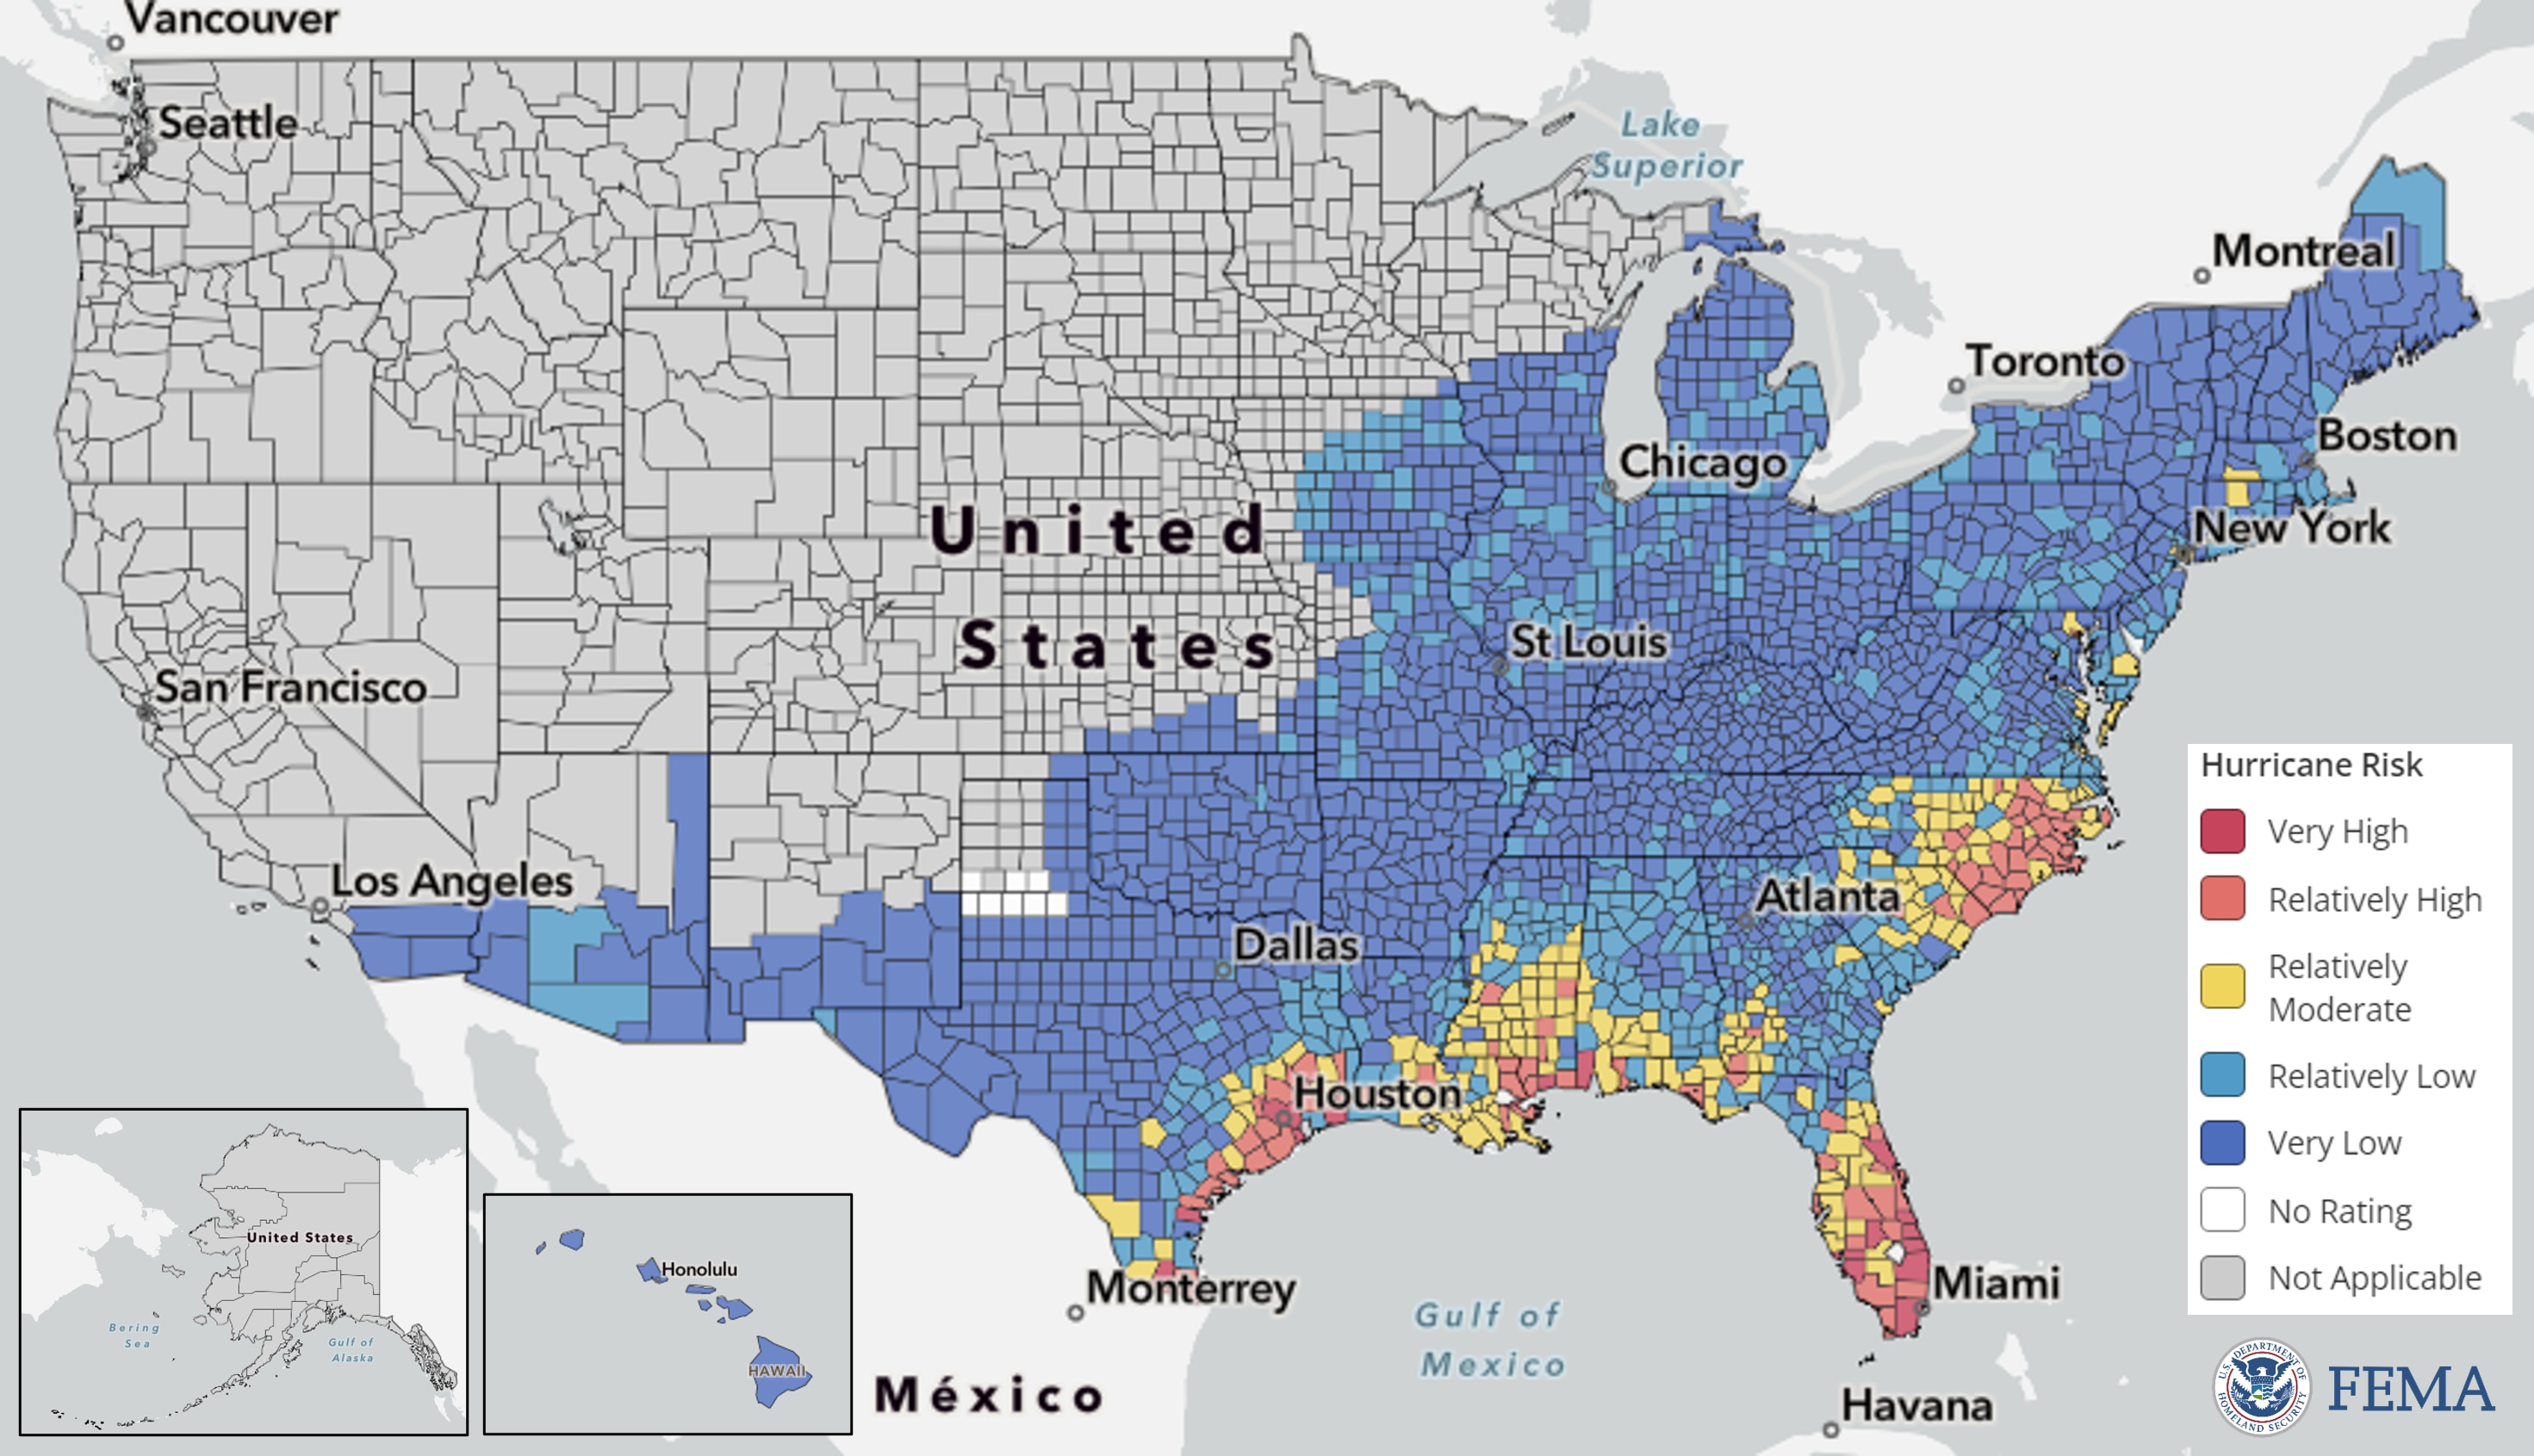
Figure: This map of the United States is colored by the relative Risk Index rating for the Hurricane hazard. The characterization of risk across these counties are based on historical records on hurricane paths and intensity.
The Federal Emergency Management Agency (FEMA) provides information on the risk of different climate hazards across the 50 states and Washington DC through the National Risk Index (NRI) platform. The Risk Index leverages available data for natural hazard and community risk factors to develop a baseline relative risk measurement for each United States county and census tract. 291 counties across 16 states are estimated to have “extremely high,” “relatively high,” or “relatively moderate” hurricane risk. In these counties, the total population at risk is 60,095,904 people.
Who is at high risk from hurricanes in the counties estimated to have “extremely high,” “relatively high,” or “relatively moderate” hurricane risk?
Risk factors vary across the 291 counties identified to have “extremely high,” “relatively high,” and “moderately high” hurricane risk. Of these counties:
49 (17%) have a high number of people aged 65 or over, living alone.
153 (53%) have a high number of people without health insurance.
70 (24%) have a high number of uninsured children.
35 (12%) have a high number of people living in rural areas.
235 (81%) have a high number of Black or African American persons.
118 (41%) have a high number of people with frequent mental distress.
154 (53%) have a high number of people living in poverty.
57 (20%) have a high number of people spending a large proportion of their income on home energy.
157 (54%) have a high number of people with severe housing cost burden.
119 (40%) have a high number of people with electricity-dependent medical equipment and enrolled in the HHS emPOWER program.
150 (52%) have a high number of people in mobile homes.
89 (31%) have a high number of people with one or more disabilities.
178 (61%) are identified as highly vulnerable by CDC’s Social Vulnerability Index.
*“A high number” indicates that these counties are in the top quartile for this indicator compared to other counties
Resources to Reduce Health Risks Associated with Hurricanes
Health risks from hurricanes include drowning due to flood water, injuries, carbon monoxide poisoning after a power outage, infection during evacuation or shelter-in-place, post-storm exposure to mold, and psychological distress.
General Preparedness
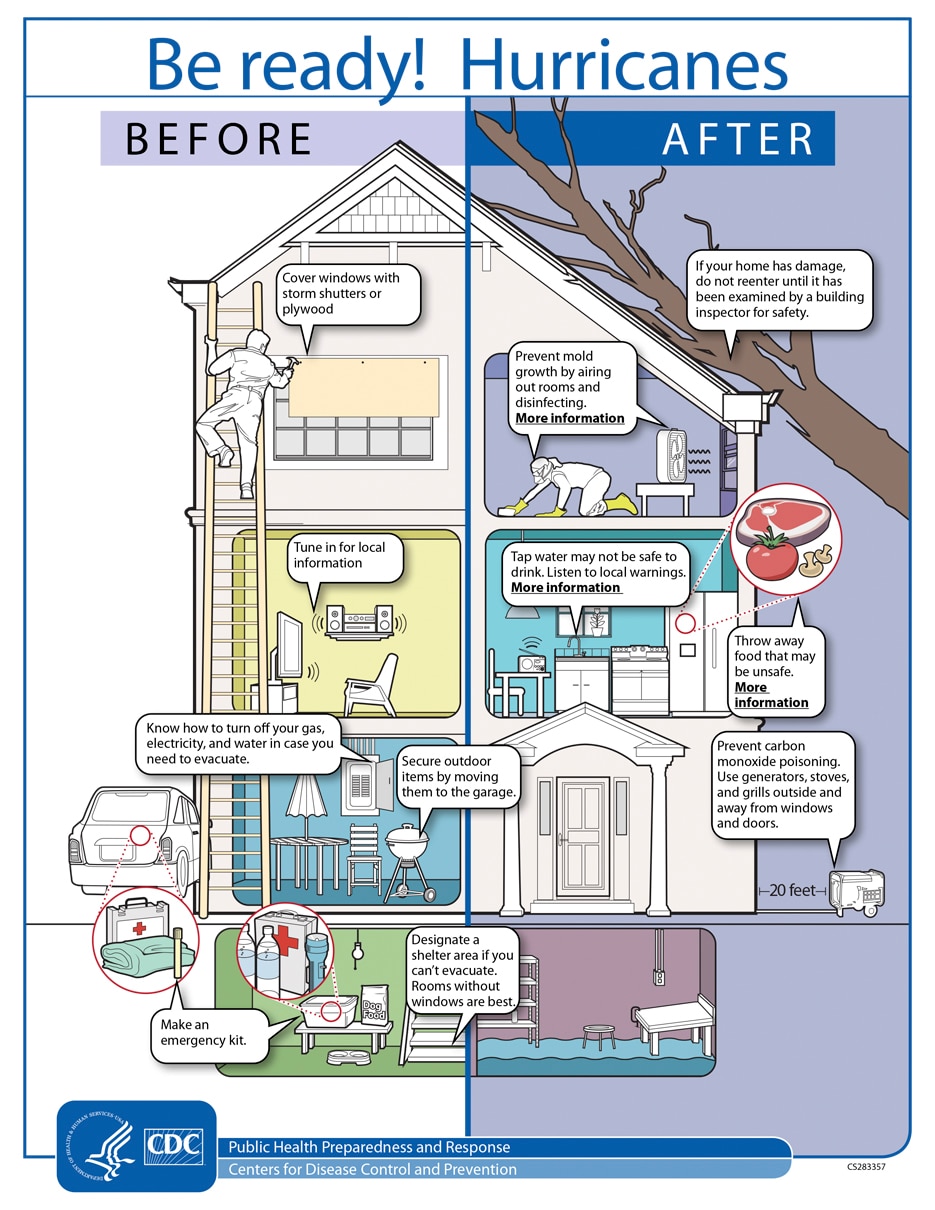
Image source: https://www.cdc.gov/cpr/infographics/br-hurricanes.htm
- Find more resources on hurricane preparedness from the Office of the Assistant Secretary for Preparedness and Response Technical Resources, Assistance Center, and Information Exchange’s (ASPR TRACIE’s) Hurricane Resources at Your Fingertips.
- The Ready.gov Hurricanes site includes information on preparing for hurricanes, staying safe during a storm, and returning home. The Ready Business site also includes a hurricane toolkit for business preparedness.
- The CDC’s Hurricanes and Other Tropical Storms site provides resources to help individuals be prepared for hurricanes and be safe after a hurricane as well as for professionals and response workers.
- The U.S. Food and Drug Administration's Hurricanes: Health and Safety site covers multiple topics to help consumers, industry stakeholders and medical providers prepare for hurricanes, including food and drug safety and using medical devices.
- If you do not have health insurance and are in a federally-identified disaster, the Emergency Prescription Assistance Program can help you get the prescription drugs, vaccinations, medical supplies, and equipment that they need.
- If you have Medicare and your medical device is damaged or lost due to an emergency or disaster, Medicare may cover the cost to repair or replace your equipment or supplies.
- You can locate and access your electronic health records from a variety of sources by using the U.S. Department of Health and Human Services' online tool.
- After natural disasters such as hurricanes, tornadoes, and floods, excess moisture and standing water contribute to the growth of mold in homes and other buildings. The Centers for Disease Control and Prevention’s (CDC) Mold After a Disaster includes information about who is at greatest risk from mold, the health effects of mold, and preventing mold growth.
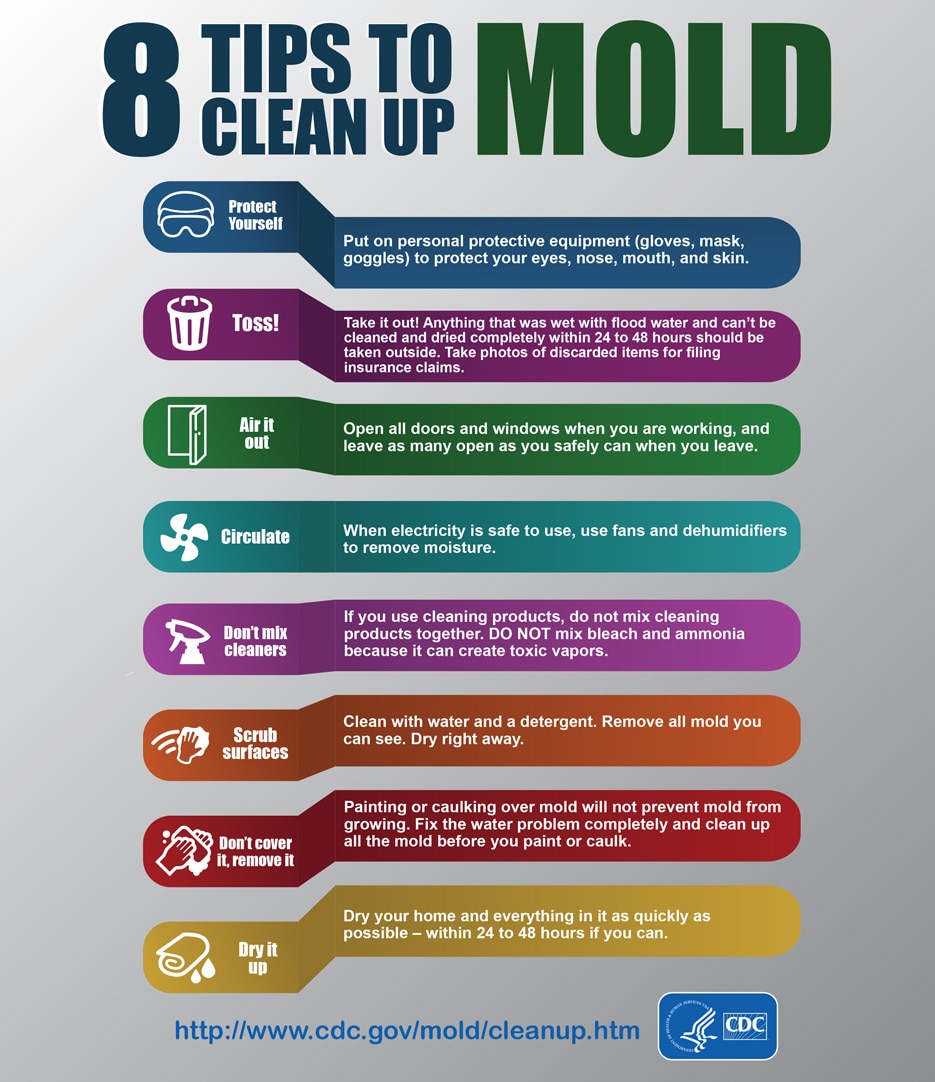
Image source: https://www.cdc.gov/disasters/mold/index.html
Mental Health
It’s normal for hurricanes and other extreme weather events to cause people to experience emotional distress. Feelings such as overwhelming anxiety, constant worrying, trouble sleeping, and other depression-like symptoms are common responses before, during, and after these types of storms. The Substance Abuse and Mental Health Services Administration Helpline and Text Service is available 24/7, free, and staffed by trained crisis counselors. Call or text 1-800-985-5990 to get help and support for any distress that you or someone you care about may be feeling related to any disaster.
Learn more about hurricanes and mental health at the SAMHSA’s Hurricanes and Tropical Storms site. SAMHSA also has other disaster behavioral health resources, including newsletters and tip sheets. ASPR TRACIE’s Disaster Behavioral Health Resources includes information about services for at-risk populations following a disaster.
Best Practices for Emergency Managers
- ASPR TRACIE’s Major Hurricanes: Potential Health and Medical Implications provides a short overview of the potential significant health and medical response and recovery needs facing hurricane- and severe storm-affected areas, based on past experience and lessons learned from Hurricanes Katrina, Sandy, Harvey, Maria, and others. The HHS emPOWER collects and shares de-identified Medicare data to help response agencies take action to protect the health of Medicare beneficiaries who depend on vulnerable electrical medical equipment.
- The CDC’s Emergency Responder Health Monitoring and Surveillance™ (ERHMSTM) framework provides recommendations for protecting emergency responders during small and large emergencies in any setting.
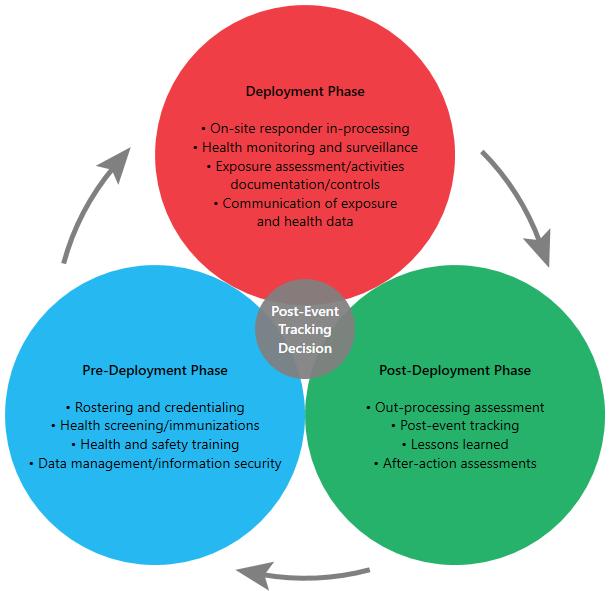
Image source: https://www.cdc.gov/niosh/erhms/default.html
- The SAMHSA Disaster Technical Assistance Center Supplemental Research Bulletin, Greater Impact: How Disasters Affect People of Low Socioeconomic Status, is designed to help disaster behavioral health professionals inform their disaster behavioral health planning for low socioeconomic status populations. SAMHSA also has developed a handbook to support disaster planning by behavioral health programs.
- The Agency for Healthcare Research and Quality’s Hospital Evacuation Decision Guidefocuses on post-event evacuations.
- ASPR TRACIE’s After the Flood: Mold-Specific Resources collects public messages, fact sheets, checklists, guidance documents, and other educational resources related to mold. They include pre-scripted (and, in some cases, already recorded) PSAs, as they are tangible and ready to implement examples of risk communication materials that can essentially be used immediately.
- The Department of Education offers tools and resources for schools and educational institutions as they manage safety, security, and emergency management programs.
Additional Resources for Public Health Safety During Hurricanes
Hurricanes can cause power outages that make it impossible to cool your home and refrigerate food. Hurricane Ida caused at least 1.2 million electricity customers to lose power. In addition, disasters like hurricanes that strike during the COVID-19 pandemic can further stress the health and medical system and threaten vulnerable residents and infrastructure.
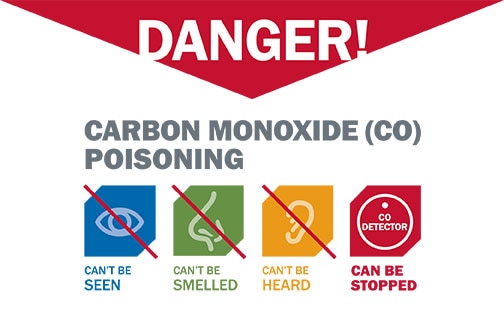
Image source: https://www.cdc.gov/co/pdfs/Flyer_Danger.pdf
- The CDC has information about What You Need to Know When the Power Goes Out Unexpectedly. To prevent carbon monoxide poisoning, use generators, pressure washers, grills, and similar items outdoors only. Generators should be used at least 20 feet away from your home.
- The CDC’s Going to a Public Disaster Shelter During the COVID-19 Pandemic provides guidance on measures to reduce the possible spread of COVID-19 among people who seek safety in a disaster shelter during severe weather events.
- Considerations for healthcare and emergency management professionals when planning for all-hazard secondary disasters during a public health emergency are available from ASPR TRACIE.
- The Federal Emergency Management Agency’s (FEMA) Exercise Starter Kit for Preparedness in a Pandemic offers ready-to-use materials and templates to your own planning workshop on preparedness in a pandemic. FEMA also offers Mass Care/Emergency Assistance Pandemic Planning Considerations For State, Local, Tribal, Territorial and Non-Government Organizational Planners, Providers and Support Agencies.
- See the Extreme Heat resources section for information on preventing heat-related illness.
Where are extremely hot days expected to be most frequent in July?
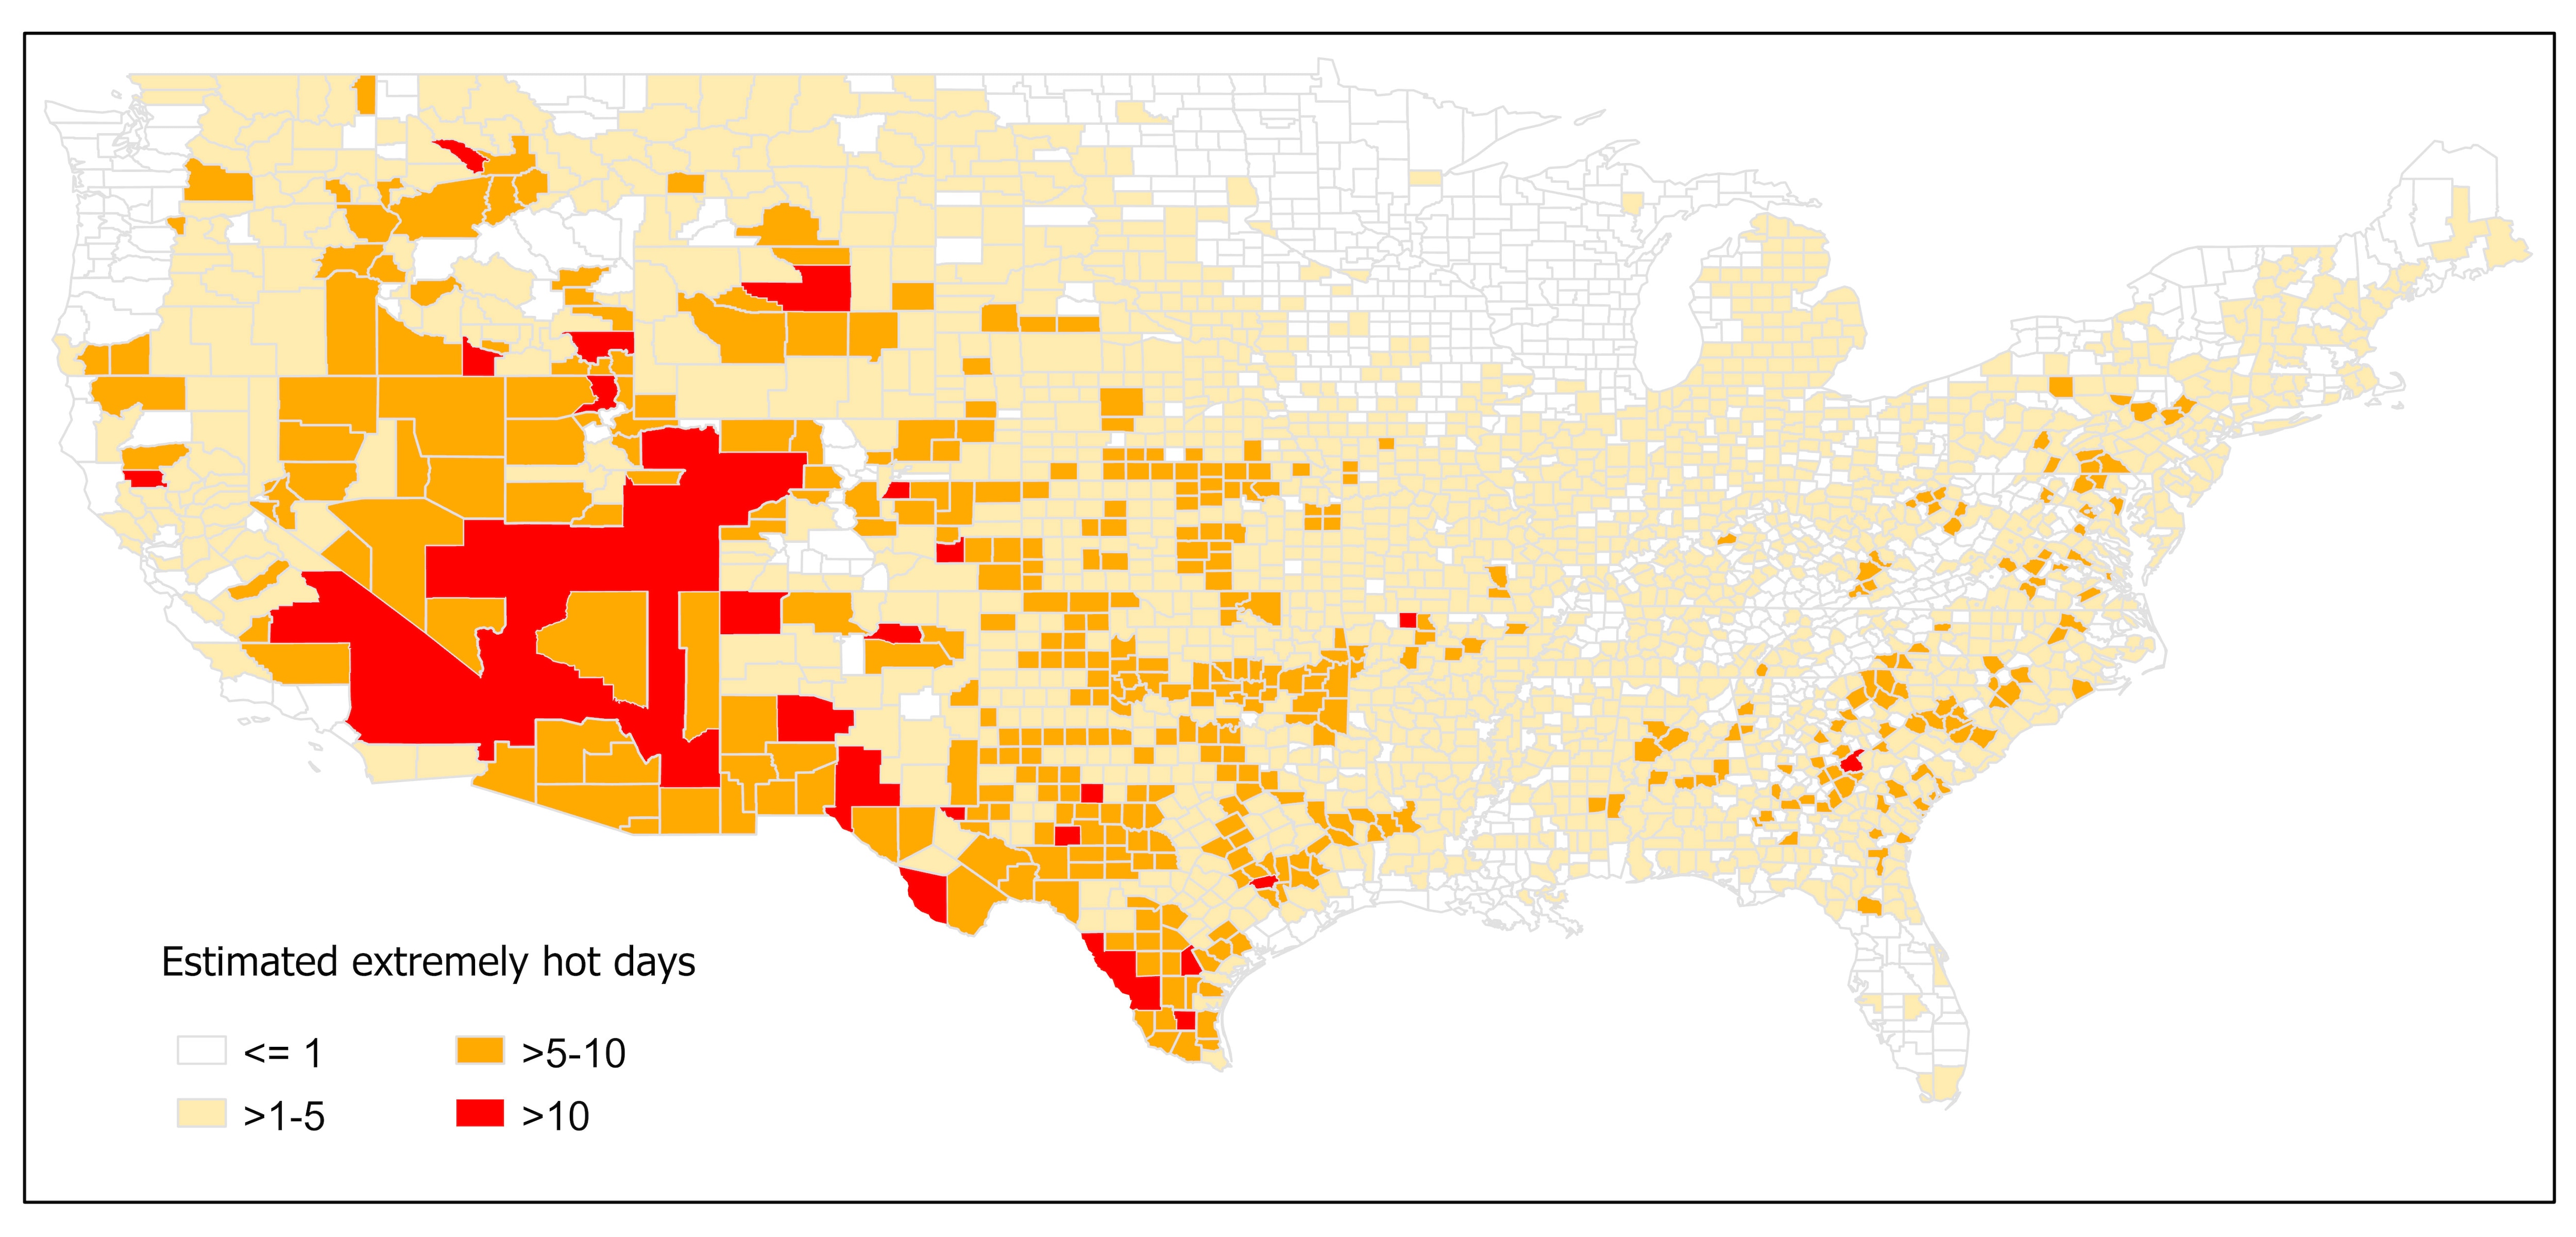
This map shows the expected number of extremely hot days in July in each county in the contiguous U.S. The forecast is based on the NOAA Climate Prediction Center’s probabilistic outlook of temperatures being above, below, or near normal in July. A county’s ‘normal’ temperature is based on the 30-year average from 1991–2020. An ‘extremely hot day’ is when the daily maximum temperature is above the 95th percentile value of the historical temperature distribution in that county. For more information on your county, please refer to the Centers for Disease Control and Prevention (CDC) Heat and Health Tracker.
Who is at high risk from heat in the counties with the most extreme heat days?
Some communities face greater health risks from extreme heat given various risk factors they face. These communities include people who: are elderly and live alone, have existing health conditions, have poor access to healthcare, live in rural areas, work outdoors, make a low income, face difficulty paying utility bills, live in poor housing, and live in urban areas without adequate tree cover. These risk factors vary across the 467 counties estimated to have more than 5 expected extreme hot days in July. Of these counties:
- 109 (23%) have a high number of people aged 65 or over, living alone.
- 212 (45%) have a high number of people without health insurance.
- 230 (49%) have a high number of uninsured children.
- 118 (25%) have a high number of people living in rural areas.
- 99 (21%) have a high number of Black or African American persons.
- 101 (22%) have a high number of people with frequent mental distress.
- 100 (21%) have a higher number of people with diabetes.
- 129 (29%) have a high number of people employed in construction.
- 154 (33%) have a high number of people living in poverty.
- 94 (20%) have a high number of people spending a large proportion of their income on home energy.
- 112 (24%) have a high number of people with severe housing cost burden.
- 120 (27%) have a high number of people with electricity-dependent medical equipment and enrolled in the HHS emPOWER program.
- 154 (33%) have a high number of people in mobile homes.
- 168 (36%) have a high number of people living in areas without adequate tree cover.
- 176 (38%) are identified as highly vulnerable by CDC’s Social Vulnerability Index.
*“A high number” indicates that these counties are in the top quartile for this indicator compared to other counties
How hot will it be, and where, over the next 3 months?
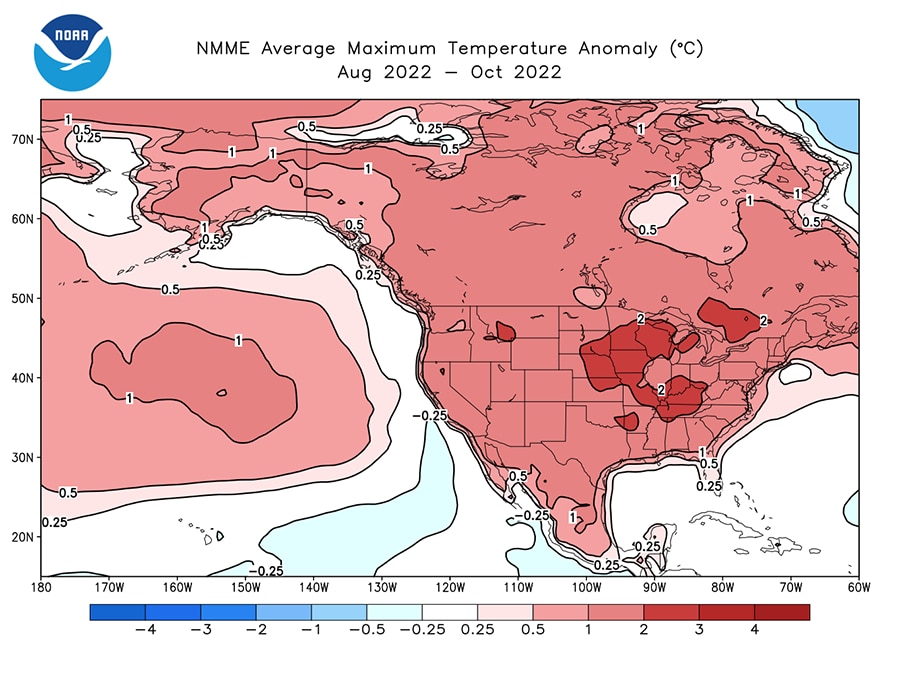
Figure: The North American Multi-Model Ensemble (NMME) predicts that average temperature over the next 3 months (July–September) will be 1.8–3.6°F (1–2°C) hotter than average across much of the contiguous U.S. For more information about this model or prediction, please refer to the NMME website.
For July–September, the North American Multi-Model Ensemble (NMME) predicts that the average temperature will be 1.8 to 3.6°F (1 to 2°C) above-normal for most of the continental United States. However, the U.S. Central and parts of the Appalachian regions may experience a higher 90-day average that is 3.6 to 5.4°F (2 to 3°C) above the normal average temperature for this time period. The NMME integrates multiple forecasts of the next 90 days to build the best estimate of temperatures and precipitation over that time frame. This year’s 90-day NMME average temperature forecast for July–September is much warmer than last year’s temperature forecast for the same period. Last summer, temperatures were predicted to be 0.9 to 3.6°F (0.5 to 2°C) above normal, whereas this summer’s forecast predicts temperatures 1.8 to 5.4°F (1 to 3°C) above normal for most of the continental United States. Note that although many regions may expect a warmer 90-day average temperature, this is not the same as your local weather forecast, in which large fluctuations in temperature may be predicted from day to day.
Is heat related illness worse in 2022 compared to last three years?
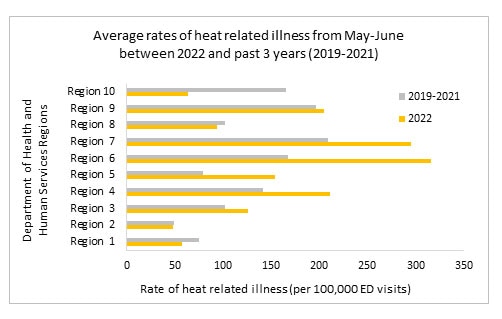
The graphic above compares the rate of heat related illness per 100,000 emergency department (ED) visits (HRI) from May to June in 2022 with the rate observed in 2019-2021 for the same months. The CDC National Syndromic Surveillance Program provides daily rates of HRI by HHS regions. The average rate of HRI was calculated by HHS regions for May 1–June 30 for 2022 and 2019-2021 separately. 6 out of the 10 HHS regions show higher HRI rates in May-June for 2022 compared to the average rate in 2019-2021. HRI rates have been particularly high in regions 4, 5, 6 and 7 in 2022, the same places that experienced the heatwave in the middle of June.
Health Impacts During the Heat Dome of 2021
During June–July 2021, the western U.S. experienced a record-breaking heat wave that lasted for several days. Estimated heat-related deaths and illnesses demonstrate the tragic toll of the heat wave on public health. Comparing the health records from June 26–July 10 between 2021 and 2020, heat-related deaths increased from 2 to 145 in Washington, 0 to 119 in Oregon, and 12 to 25 in California. These estimates were provided by the California Department of Public Health, Oregon Health Authority, and Washington State Department of Health. For context, the CDC estimates an average of 702 heat-related deaths per year for the entire U.S. (based on 2004–2018 data).
Heat Affects Health in Many Ways
Warmer temperatures increase the risk for a diverse range of health risks. For example:
- An increased risk of hospitalization for heart disease.
- Heat exhaustion, which can lead to heat stroke if not treated, can cause critical illness, brain injury,
and even death. - Worsening asthma and chronic obstructive pulmonary disease (COPD) as heat increases the production of ground-level ozone.
- Dehydration, which can lead to kidney injury and blood pressure problems. Some kidney damage can become irreversible with repeated or untreated injury.
- Violence, crime, and suicide may increase with temperature, adding to the rates of depression and anxiety already associated with climate change
- Some medications increase the risk of heat-related illness. These include diuretic medicines (sometimes called “water pills”), antihistamine medicines (including many allergy medicines), and many antipsychotic medicines used to treat a variety of psychiatric and neurologic illnesses. Please review this list of common psychiatric medications that can impair the body’s normal ability to cool itself.
Spotlight on Health Equity: Health Impacts in Rural Areas
![Emergency Department Visits with a Diagnosis Directly Indicating Heat Exposure per 100,000 Population, 2016-2019. Source: Agency for Healthcare Research and Quality (AHRQ), Healthcare Cost and Utilization Project (HCUP), State Emergency Department Databases (SEDD) and State Inpatient Databases (SID), 2016-2019.]](https://public3.pagefreezer.com:443/content/HHS.gov/28-07-2022T13:43/https://www.hhs.gov/sites/default/files/nonsupp-heat-stcofips-2016-2019-alled.png)
In April 2022, Agency for Healthcare Research and Quality used the Healthcare Cost and Utilization Project (HCUP) 2016–2019 to estimate county-level population rates of emergency department (ED) visits with a diagnosis directly indicating heat exposure. The analysis was limited to records of ED visits, regardless of hospital admission, at community hospitals, excluding rehabilitation and long-term acute care facilities, with any-listed diagnosis directly indicating heat exposure. This analysis includes ED data from 2,550 counties in 39 States and the District of Columbia, representing 85 percent of the population and 81 percent of all counties in the United States in 2019. Among the 1,122 rural counties, 152 (13.5%) had heat-related ED visit population rates of 85 or more per 100,000 population (i.e., 90th percentile of population rates). In contrast, among the 344 large metropolitan counties, 8 (2.3%) had heat-related ED visit population rates in the 90th percentile. The report highlights that a larger proportion of rural than large metropolitan counties experience a high rate of heat-related illness, although there are more heat-related ED visits in large metropolitan areas (n=135,585 ED visits) than in rural areas (n=30,115 ED visits).
Resources for People at High Risk of Heat-Related Health Problems
Certain populations with limited resources may have restricted access to information on heat illness prevention, cool indoor environments, and government programs that provide critical support. Find more resources on heat illness prevention from the National Integrated Heat Health Information System (NIHHIS) and CDC websites.
Worker Health
Occupations that require strenuous work outdoors pose a high risk for heat-related illness. This includes construction workers, farmers, agricultural workers, delivery workers, athletes, landscapers, and others. Learn more about the dangers of working in heat. Employer responsibilities and resources for safety are also available through the Occupational Safety and Health Administration (OSHA) Heat Illness Prevention campaign.
- The Heat Safety Tool provides real-time heat index and hourly forecasts, specific to your location, as well as occupational safety and health recommendations from OSHA and the National Institute for Occupational Safety and Health (NIOSH).
- The National Institute of Environmental Health Sciences (NIEHS) Worker Training Program has heat safety and health training for at-risk workers.
- The Health Resource Services Administration (HRSA) funds National Training and Technical Assistance Partners — Farmworker Justice and Migrant Clinicians Network that helps clinicians prevent and treat heat-related illness among agricultural workers.
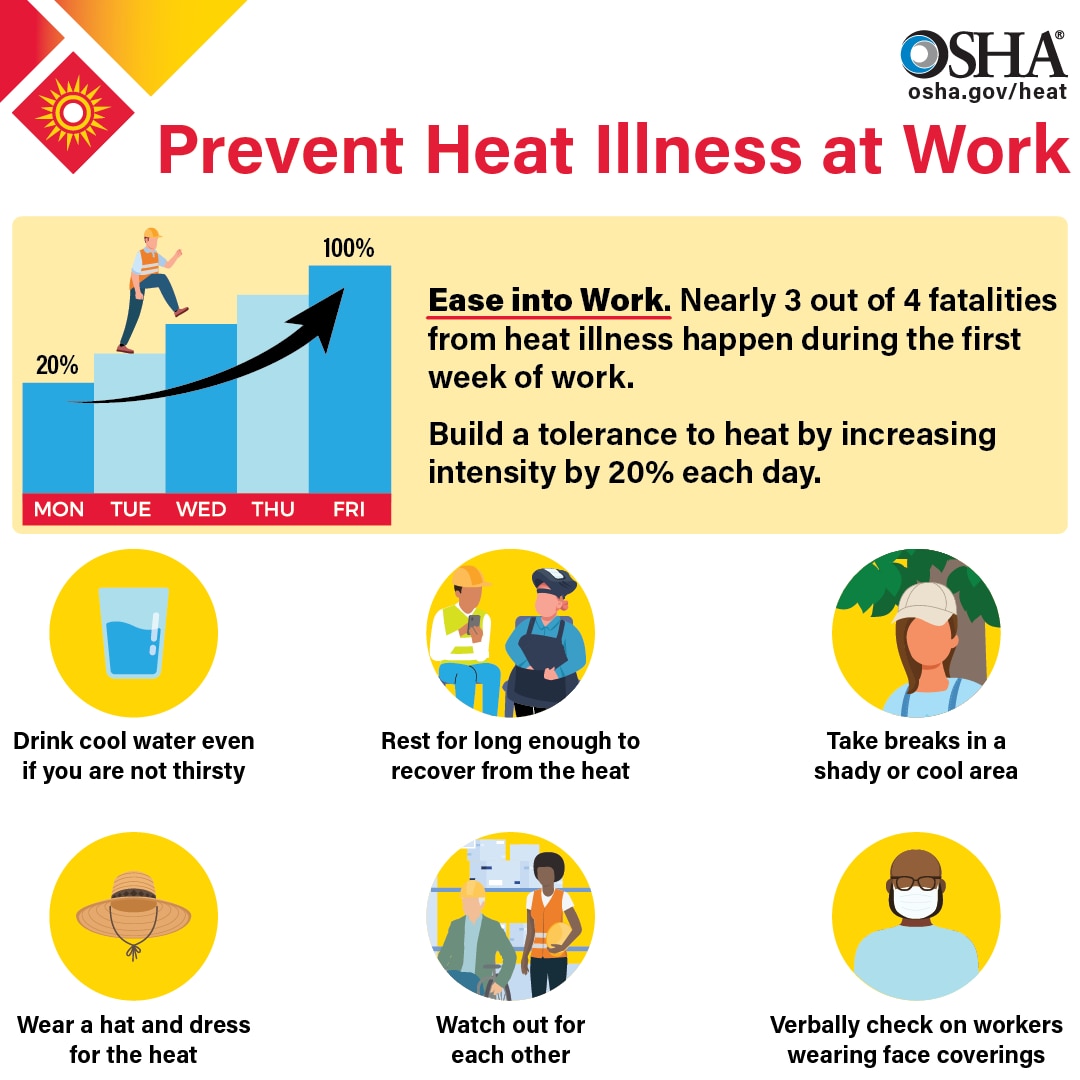
Image source: https://www.osha.gov/heat
Staying Safe Indoors
- The Low Income Home Energy Assistance Program (LIHEAP) and the Weatherization Assistance Program (WAP) help keep families safe and healthy through initiatives that assist families with energy costs. To inquire about LIHEAP assistance, call the National Energy Assistance Referral (NEAR) hotline at
1-866-674-6327. - The National Institute on Aging resource Hot Weather Safety for Older Adults offers background information on heat stroke, who is at risk, lowering your risk, and best practices.
- Medicare Advantage (MA) plans may provide Special Supplemental Benefits for the Chronically Ill (SSBCI) with equipment and services that improve indoor air temperatures and quality (such as portable air conditioners) to chronically ill patients.
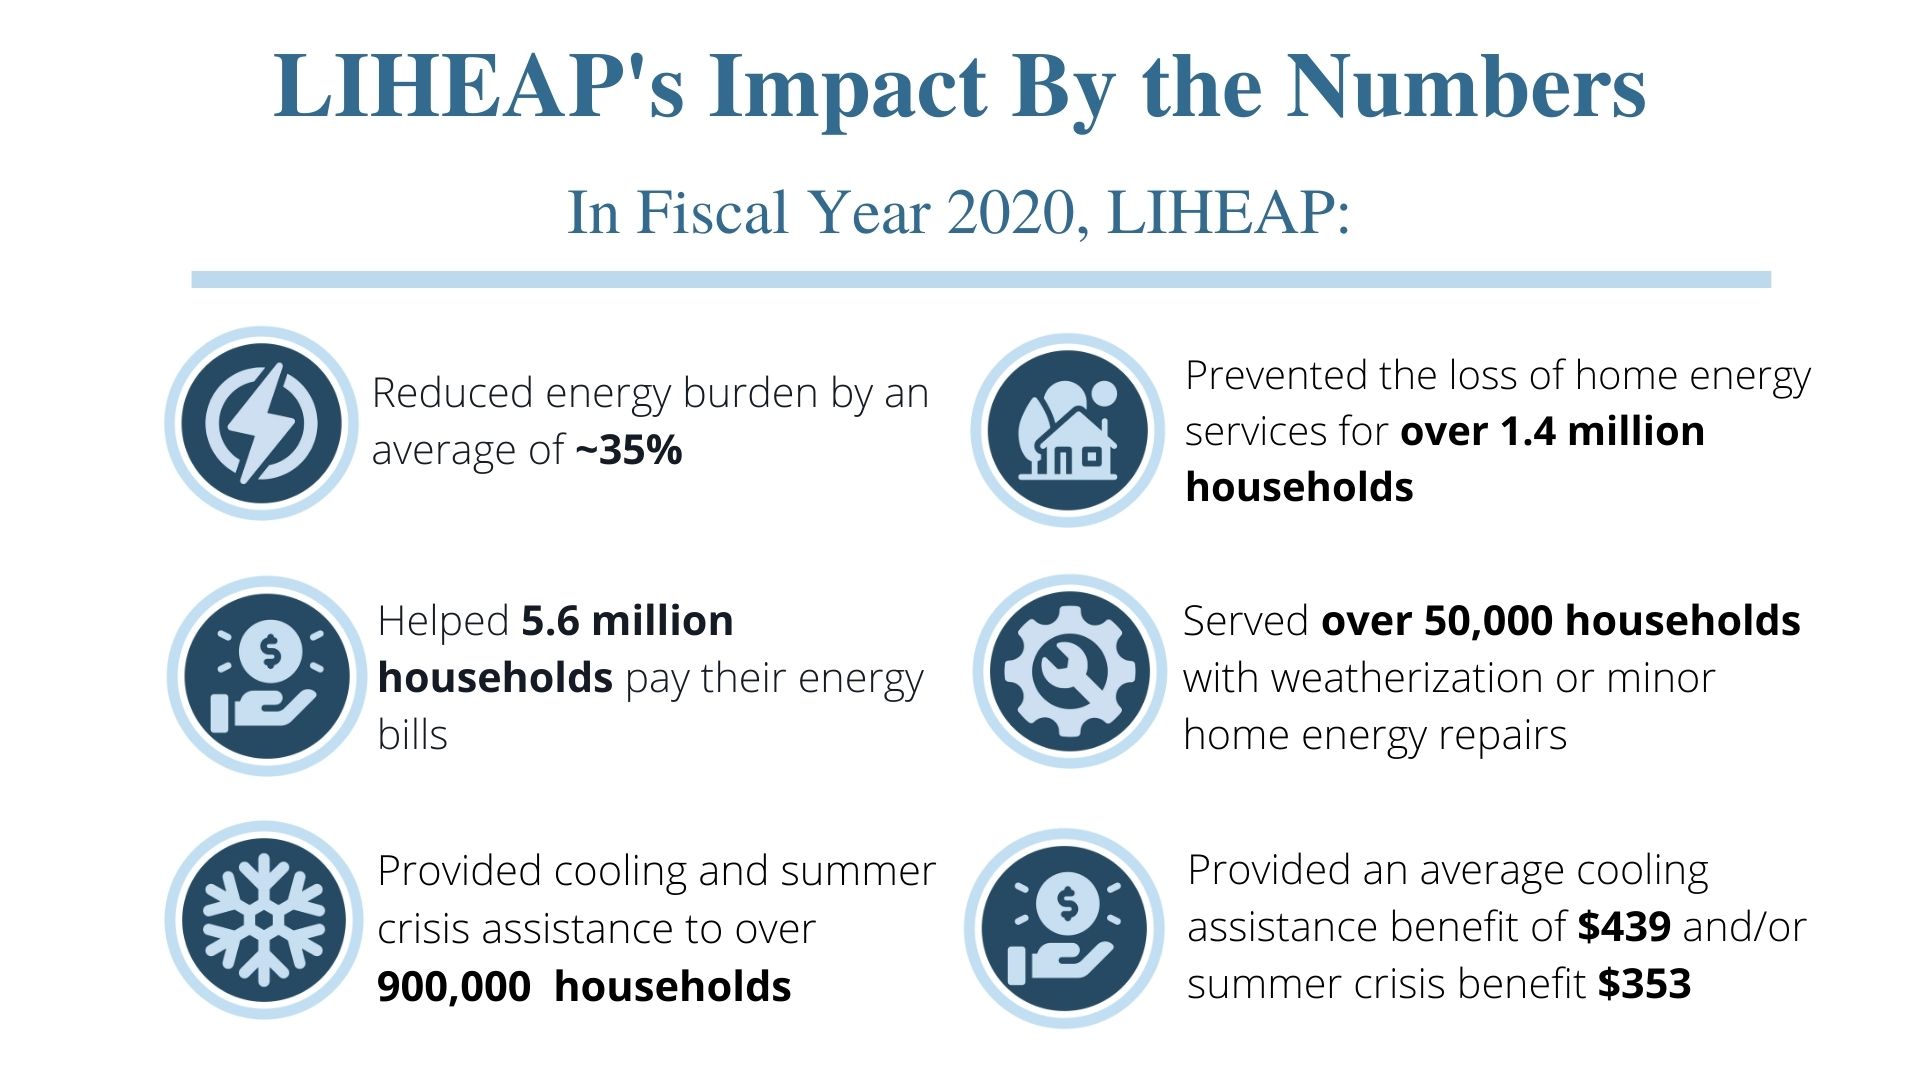
Image sources: https://www.acf.hhs.gov/sites/default/files/documents/ocs/COMM_LIHEAP_Earth%20Day_FY2022.pdf, https://liheappm.acf.hhs.gov/datawarehouse
Best Practices for Emergency Managers
This CDC report on Heat Response Plans reviews steps emergency managers and health officials can take to develop and implement measures to protect their communities. Spikes in energy demand should be expected during summer months as air conditioning use increases. The combination of sagging power lines (copper expands as it heats up, thus increasing impedance and reducing throughput) and increased energy demands can cause power failures that make certain populations more vulnerable when the risk is highest. The HHS emPOWER pcollects and shares de-identified Medicare data to help response agencies take action to protect the health of Medicare beneficiaries who depend on vulnerable electrical medical equipment.
Real-time information on health impacts from extreme heat can also help decision-makers implement strategies to reduce risk. CDC’s Heat and Health Tracker provides regular updates on the rate of heat-related Emergency Department visits (organized by HHS regions) and observed temperature.
If you are a local organization planning to open a cooling shelter, consider referring to CDC guidance on how to maintain a safe shelter during a heat wave.
Clinical Best Practices
A heat stroke is a medical emergency, and rapid recognition and aggressive early treatment are essential to reduce morbidity and mortality (as illustrated below).
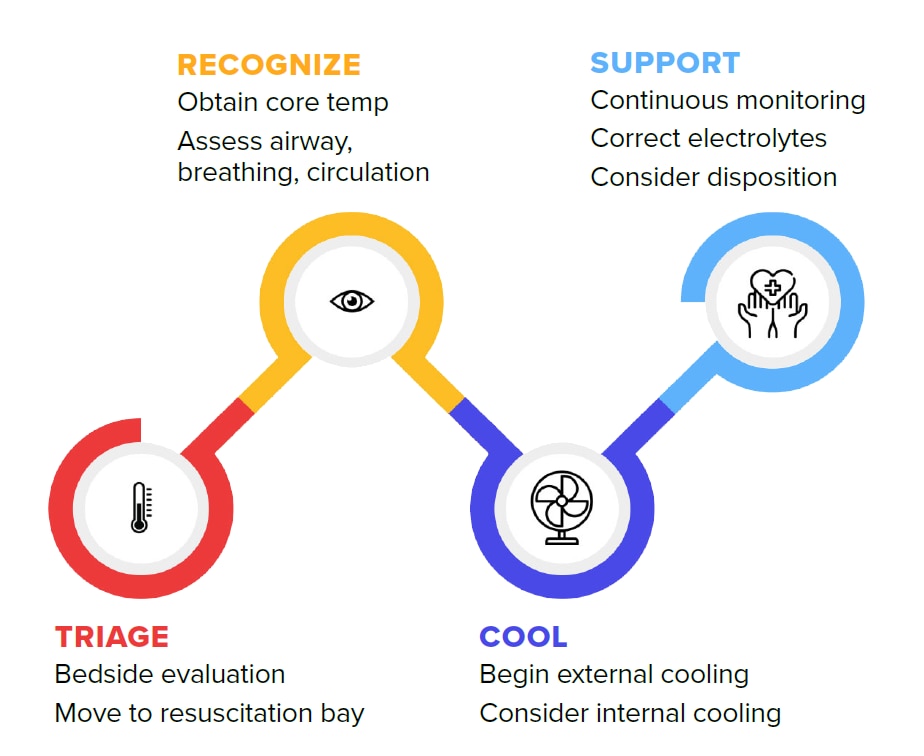
See https://pubmed.ncbi.nlm.nih.gov/33856299/ for the full algorithm.
Climate and Health Outlook: Extreme Heat | June 2022
This edition focuses on the months of June-August, 2022 and uses the most current long-term temperature forecasts that come from the National Oceanic and Atmospheric Administration (NOAA) to illustrate how extreme heat poses a health risk for all Americans.
Download the Climate and Health Outlook for June 2022
Climate and Health Outlook: Extreme Heat | May 2022
As our climate changes, extreme heat events will become more frequent, longer lasting, and more severe. Using temperature projections from NOAA and other partners, this outlook draws attention to the parts of the country and populations at higher health risk from extreme heat exposure. It also provides actionable information and resources from the Department of Health and Human Services for individuals, healthcare professionals, and public health officials to take proactive action that can reduce risk.
Download the Climate and Health Outlook for May 2022*
* This content is in the process of Section 508 review. If you need immediate assistance accessing this content, please submit a request to OCCHE@HHS.gov. Content will be updated pending the outcome of the Section 508 review.