

Where Was Heat Abnormally High in 2022?
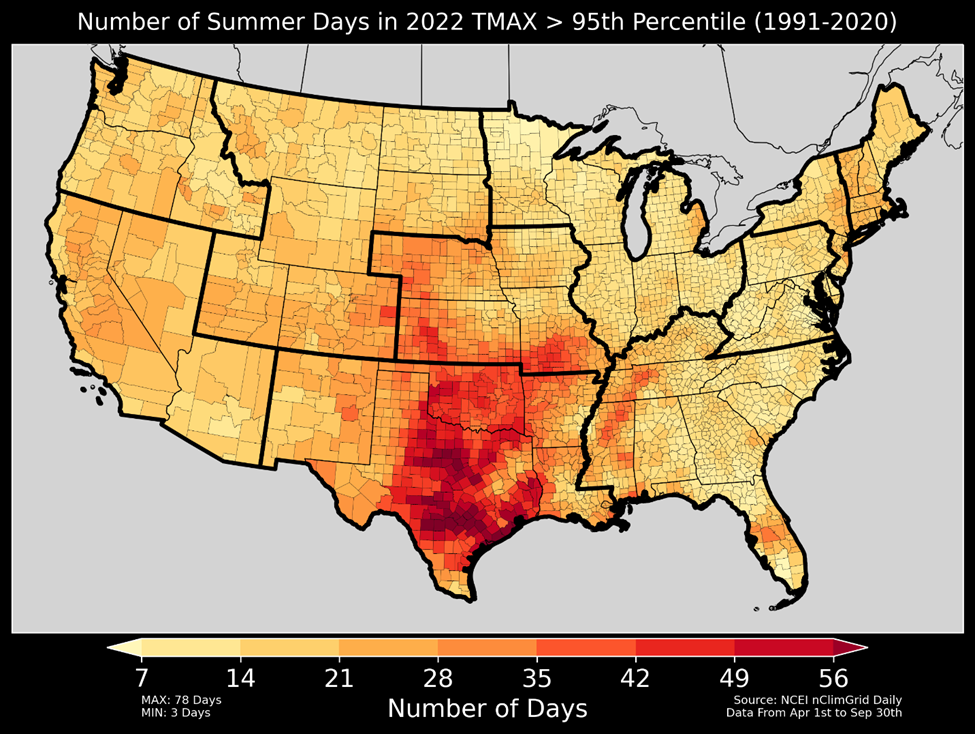
Figure. Temperature is calculated from NOAA’s nClimGrid-Daily v1-0-0, a 5km gridded dataset aggregated into counties for the contiguous US. For each day between April 1st to September 30th, a county’s temperature in 2022 is compared against its climatological normal from 1991-2020. Temperatures above the 95th percentile are considered abnormally hot for the region.
This map depicts the number of summer days in 2022 (April 1st to September 30th) when a county’s maximum temperature exceeded its 95th percentile, thus indicating an abnormally hot day. Much of the southern great plains, including Texas, Oklahoma, Arkansas, Missouri, Kansas and Nebraska experienced more than a month’s worth of hot temperatures.
* Thick lines indicate HHS regional boundaries.
Region 1: CT, ME, MA, NE, RI, VT
Region 2: NJ, NY, PR, VI
Region 3: DE, DC, MD, PA, VA, WV
Region 4: AL, FL, GA, KY, MS, NC, SC, TN
Region 5: IL, IN, MI, MN, OH, WI
Region 6: AR, LA, NM, OK, TX
Region 7: IA, KS, MO, NE
Region 8: CO, MT, ND, SD, UT, WY
Region 9: AZ, CA, HI, NV, AS, MP, FSM, GU, MH, PW
Region 10: AK, ID, OR, WA
Is Heat Related Illness Worse In 2022 Compared to the Last Four Years?
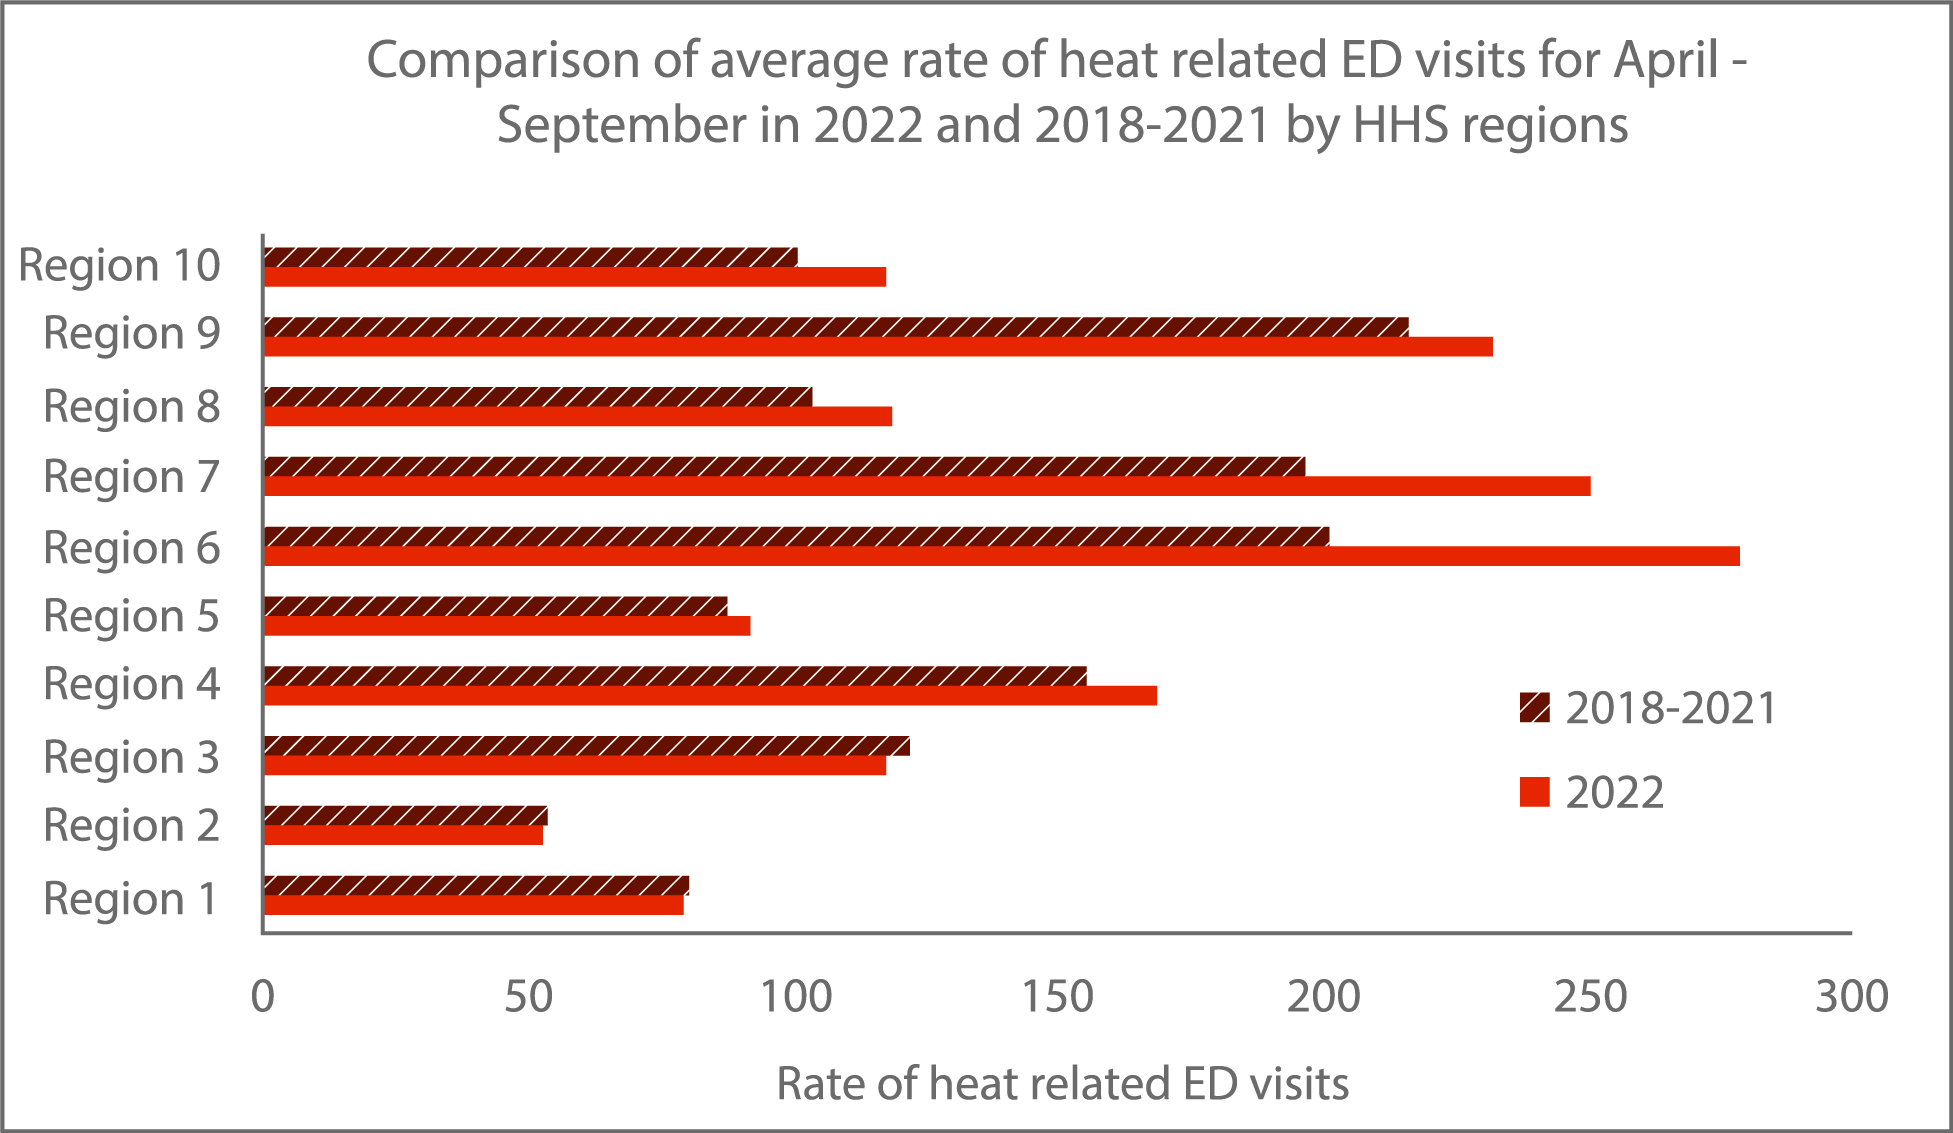
Figure. The CDC National Syndromic Surveillance Program (NSSP) provides daily rates of heat related illness (HRI) by HHS Regions. NSSP is a network comprising CDC representatives, state and local health departments, and academic and private sector health partners jointly collecting and sharing electronic patient encounter data.*
The graphic above compares the rate of HRI per 100,000 emergency department (ED) visits from April to September in 2022 with the rate observed in 2018-2021 for the same months. The average rate of HRI was calculated by HHS regions for April 1– September 30 for 2022 and 2018-2021 separately after quality control filters were applied to allow comparison across years. The average HRI rates in 2022 were higher in 7 out of 10 HHS regions when compared to the average rates in 2018-2021. Particularly noteworthy were the higher rates of HRI in HHS regions 6 and 7 in 2022.
For more information on HHS regions, see list above.
* NSSP includes ED visit data from approximately 72% of non-federal U.S. EDs. Fewer than 50% of facilities in CA, Hawaii, Iowa, Minnesota, and Oklahoma report to NSSP. MO discharge data is incomplete.
Oregon Health Plan Responds to Extreme Heat
The Centers for Medicare & Medicaid Services recently approved a Medicaid 1115 waiver from the Oregon Health Plan to allow coverage of medically necessary air conditioners, heaters, humidifiers, air filtration devices, generators, and refrigeration units when certain requirements are met. Oregon has increasingly struggled with climate change-related health threats. In 2021, record-breaking heat resulted in the loss of over 100 lives (see July Outlook discussion of the Health Impacts During the Heat Dome of 2021). Extreme heat and wildfires have a significant impact on the health and well-being of millions of people in Oregon each year, particularly low-income and historically marginalized groups. To respond to these threats, the Oregon Health Plan is working on establishing a dedicated Medicaid unit to address climate impact on public health. This waiver will allow Oregon to expand its volume and capacity to respond to climate emergencies with cooling and air filtration equipment. The waiver builds on previous state legislation (Senate Bills 1536 and 762), which funded the Oregon Health Authority to provide air conditions and other equipment to Medicaid recipients. During 2022, OHA and its partners identified qualifying individuals who could be at-risk using data like the Oregon Heat Hazard Report. Oregon Health Plan’s goal through its waiver and other activities is to prevent injury, illness and/or death due to the extreme or prolonged heat exposure.
Increasing Assistance for Americans to Cool Their Homes
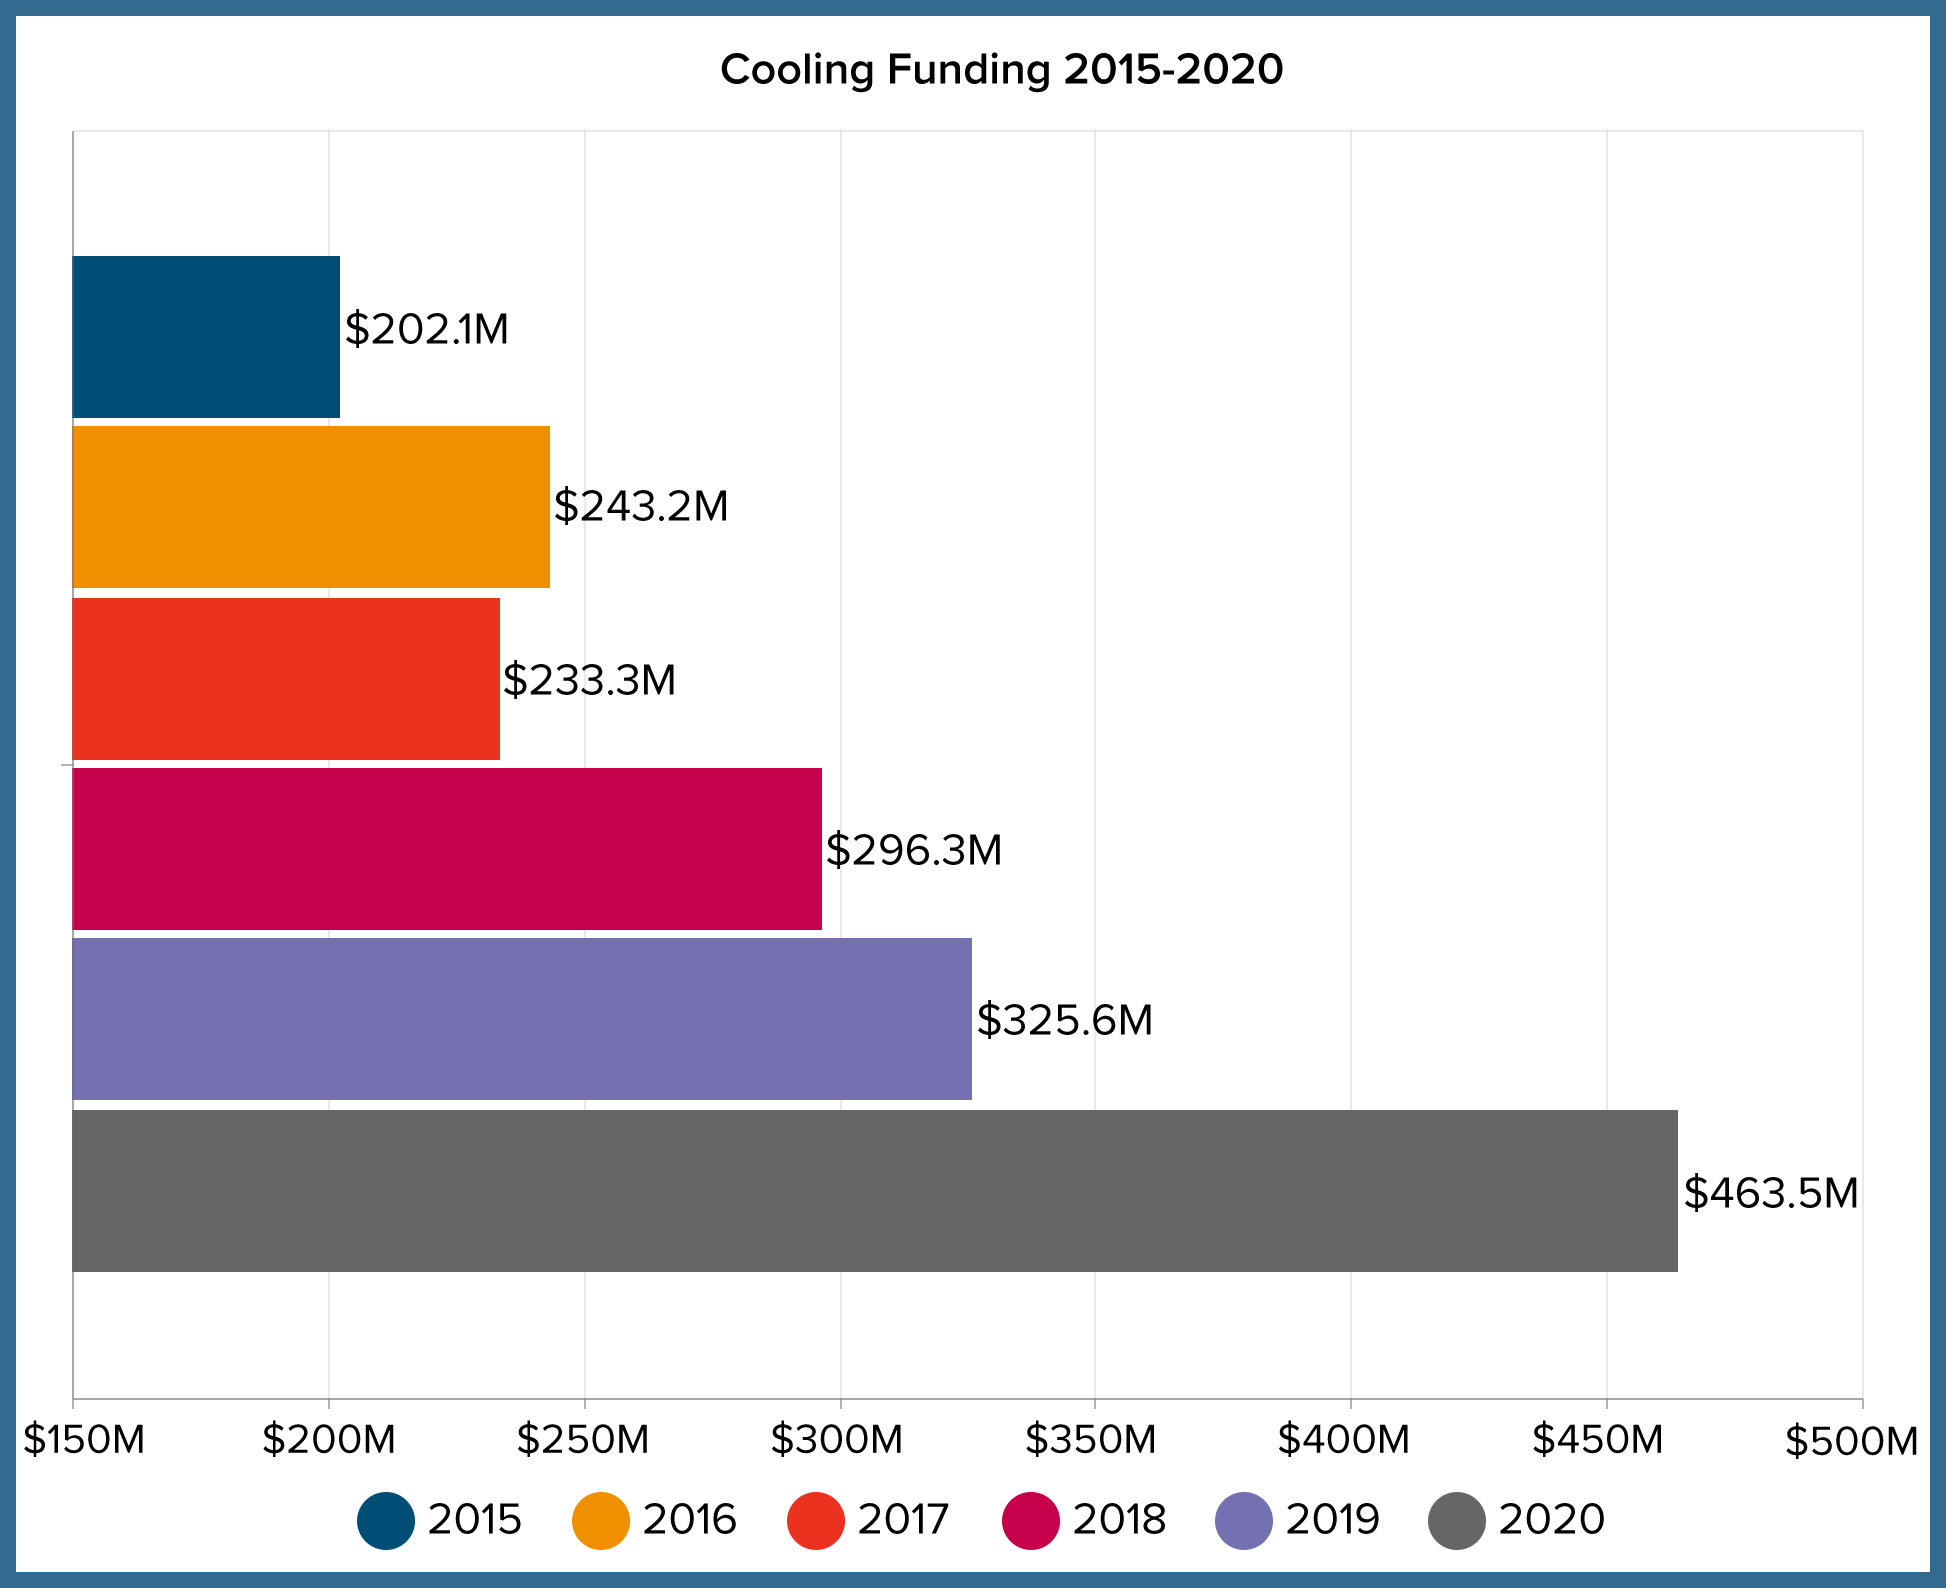
Figure. The Office of Community Services (OCS) at the Administration for Children and Families implement The Low-Income Home Energy Assistance Program, known as LIHEAP, to mitigate heat stress and ensure households can stay safe and cool in their homes. The above chart illustrates cooling assistance spending from 2015 - 2020 from state LIHEAP grant recipients.
On July 19, 2022, OCS issued updated guidance outlining all the ways grant recipients can use LIHEAP funding to mitigate heat stress. A total of 27 states and the District of Columbia provided cooling assistance benefits in Fiscal Year (FY) 2022; an increase of 4 states compared to FY 2021. Multiple grant recipients implemented cooling programs for the first time in FY 2022 including North Carolina, Washington, and the Pueblo of Laguna Tribe. Additionally, many grant recipients significantly expanded their cooling programs. For example, New York (NY) has historically only provided cooling benefits to households with a medical need for an air conditioner and typically allocates approximately $3-9 million for cooling assistance each year. In FY 2022, NY allocated $23 million for cooling assistance and expanded eligibility to all LIHEAP eligible households, not just those with a medical need. Preliminary FY 2021 data indicates that 23 states and the District of Columbia provided an estimated $564 million for cooling assistance. OCS is committed to continuing to help LIHEAP grant recipients utilize program flexibilities to mitigate heat stress and provide cooling assistance to vulnerable households.
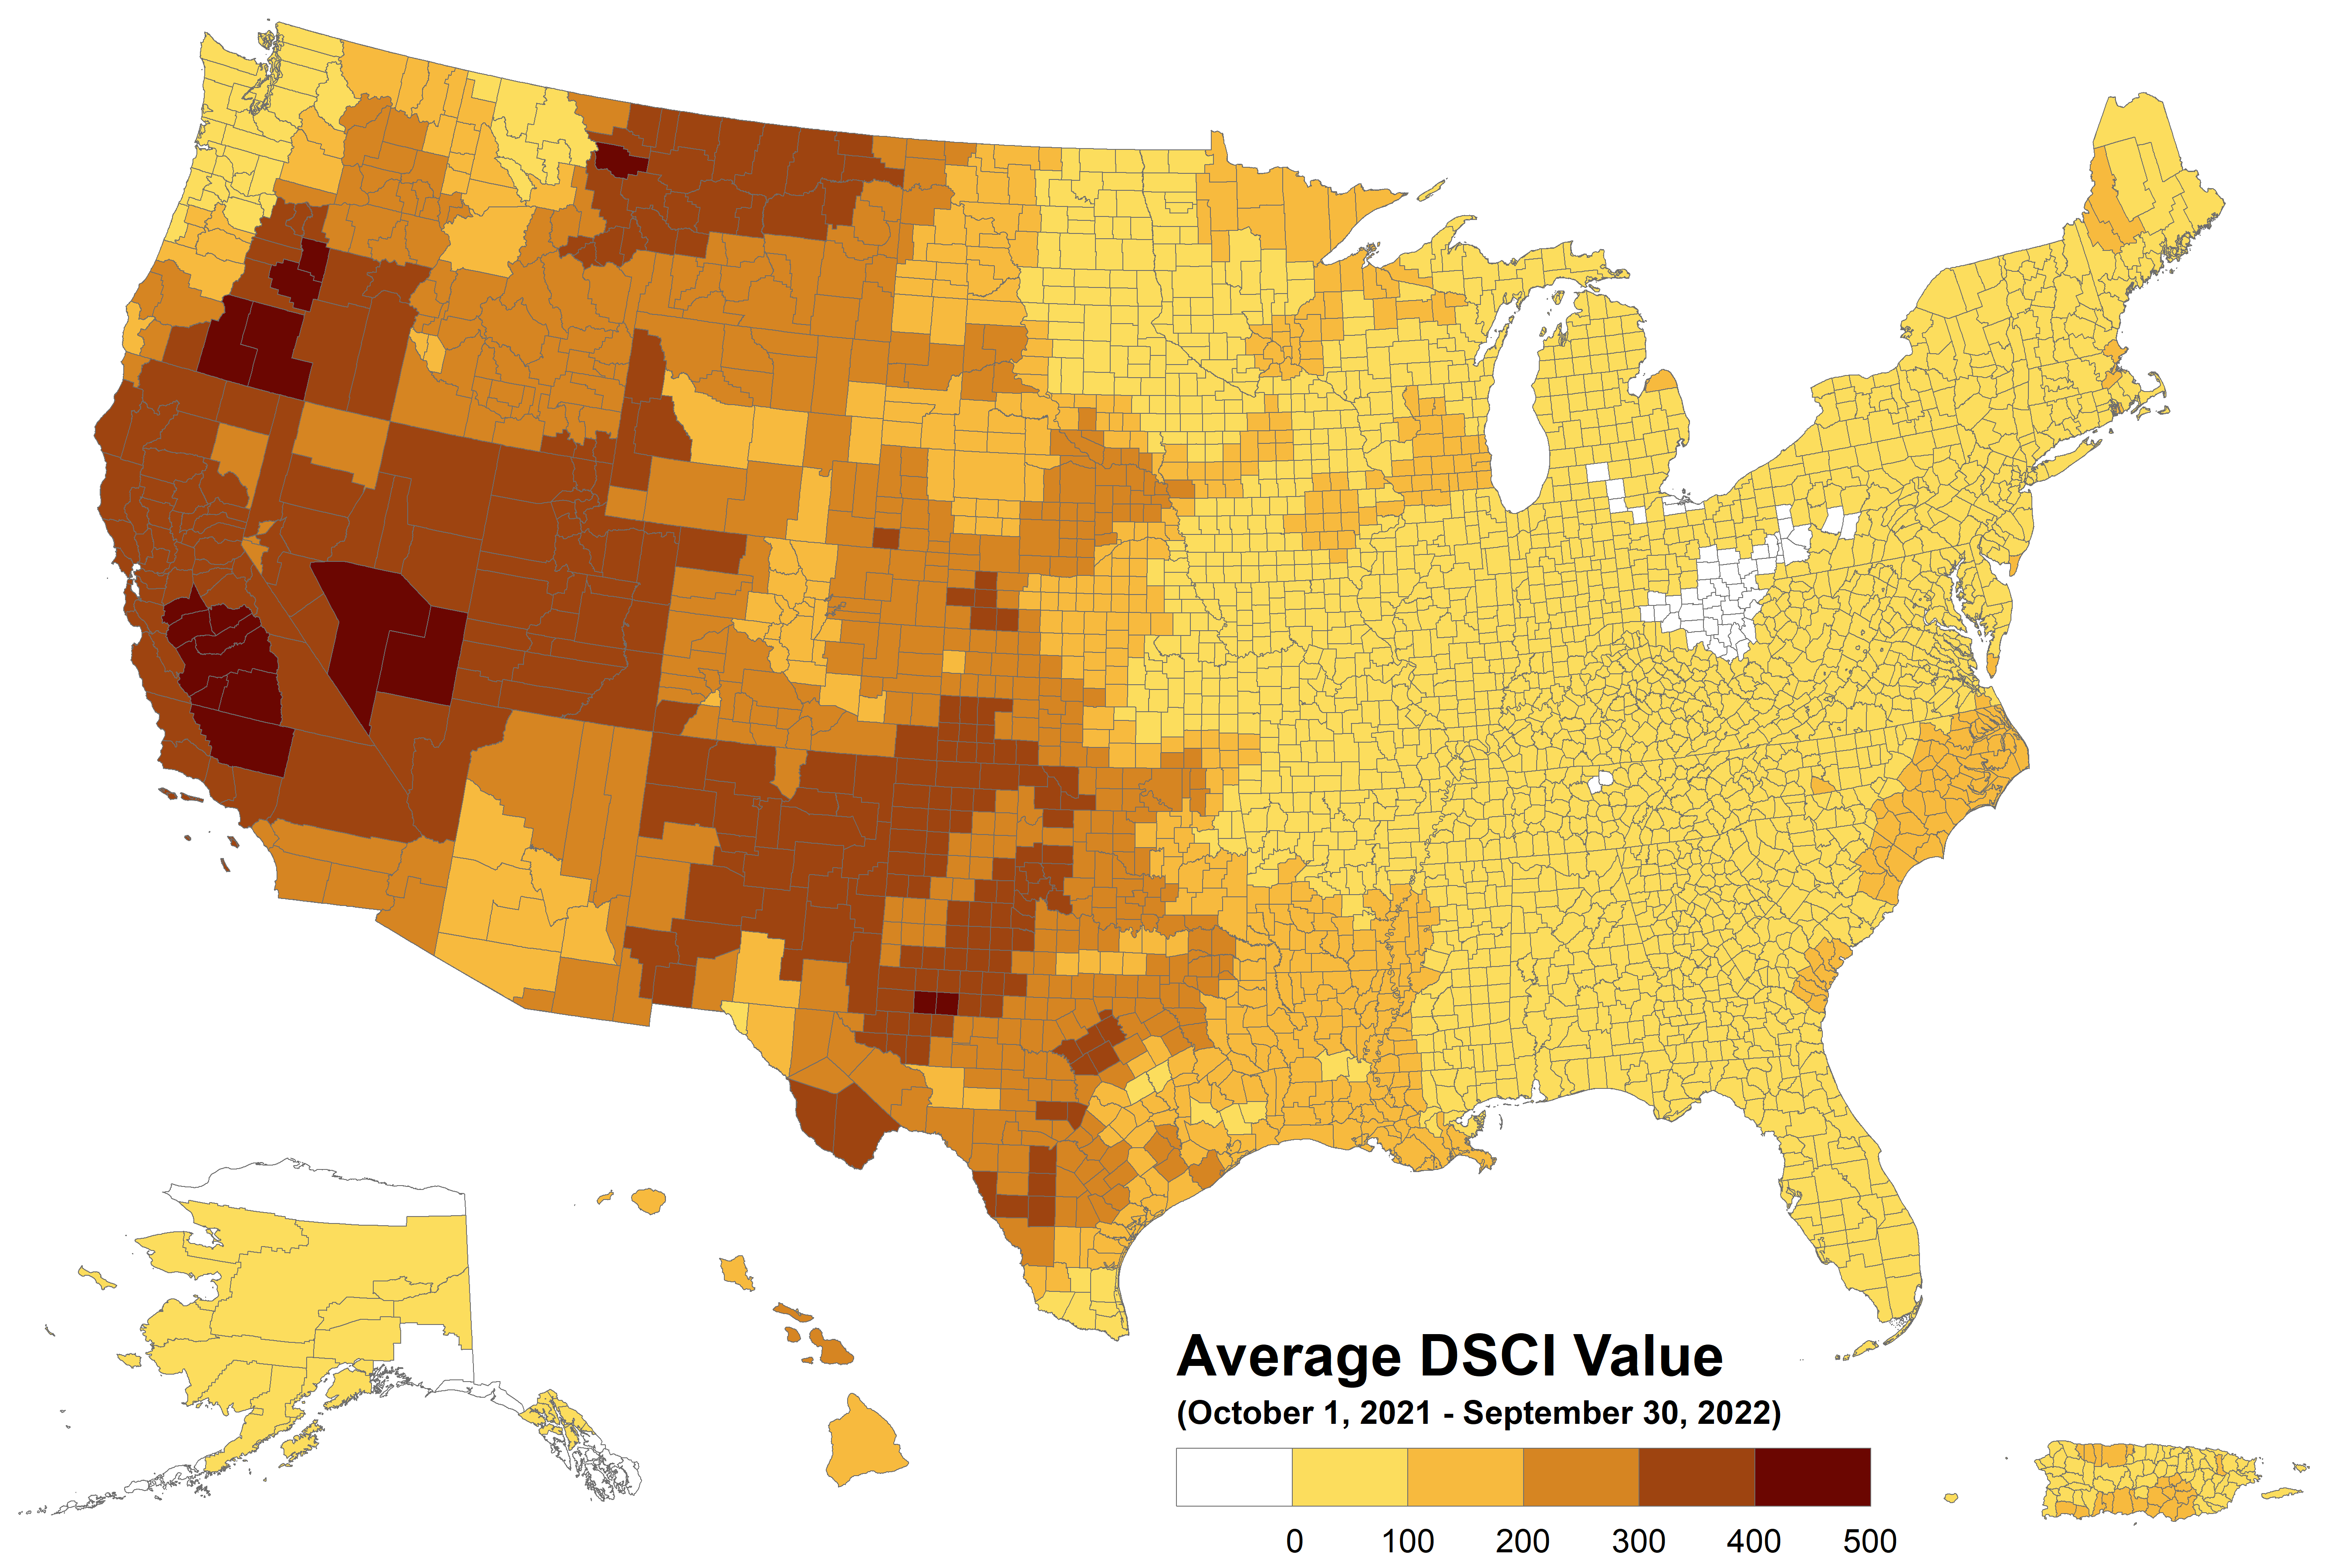
Average Drought Level Across the U.S. in the Past Year
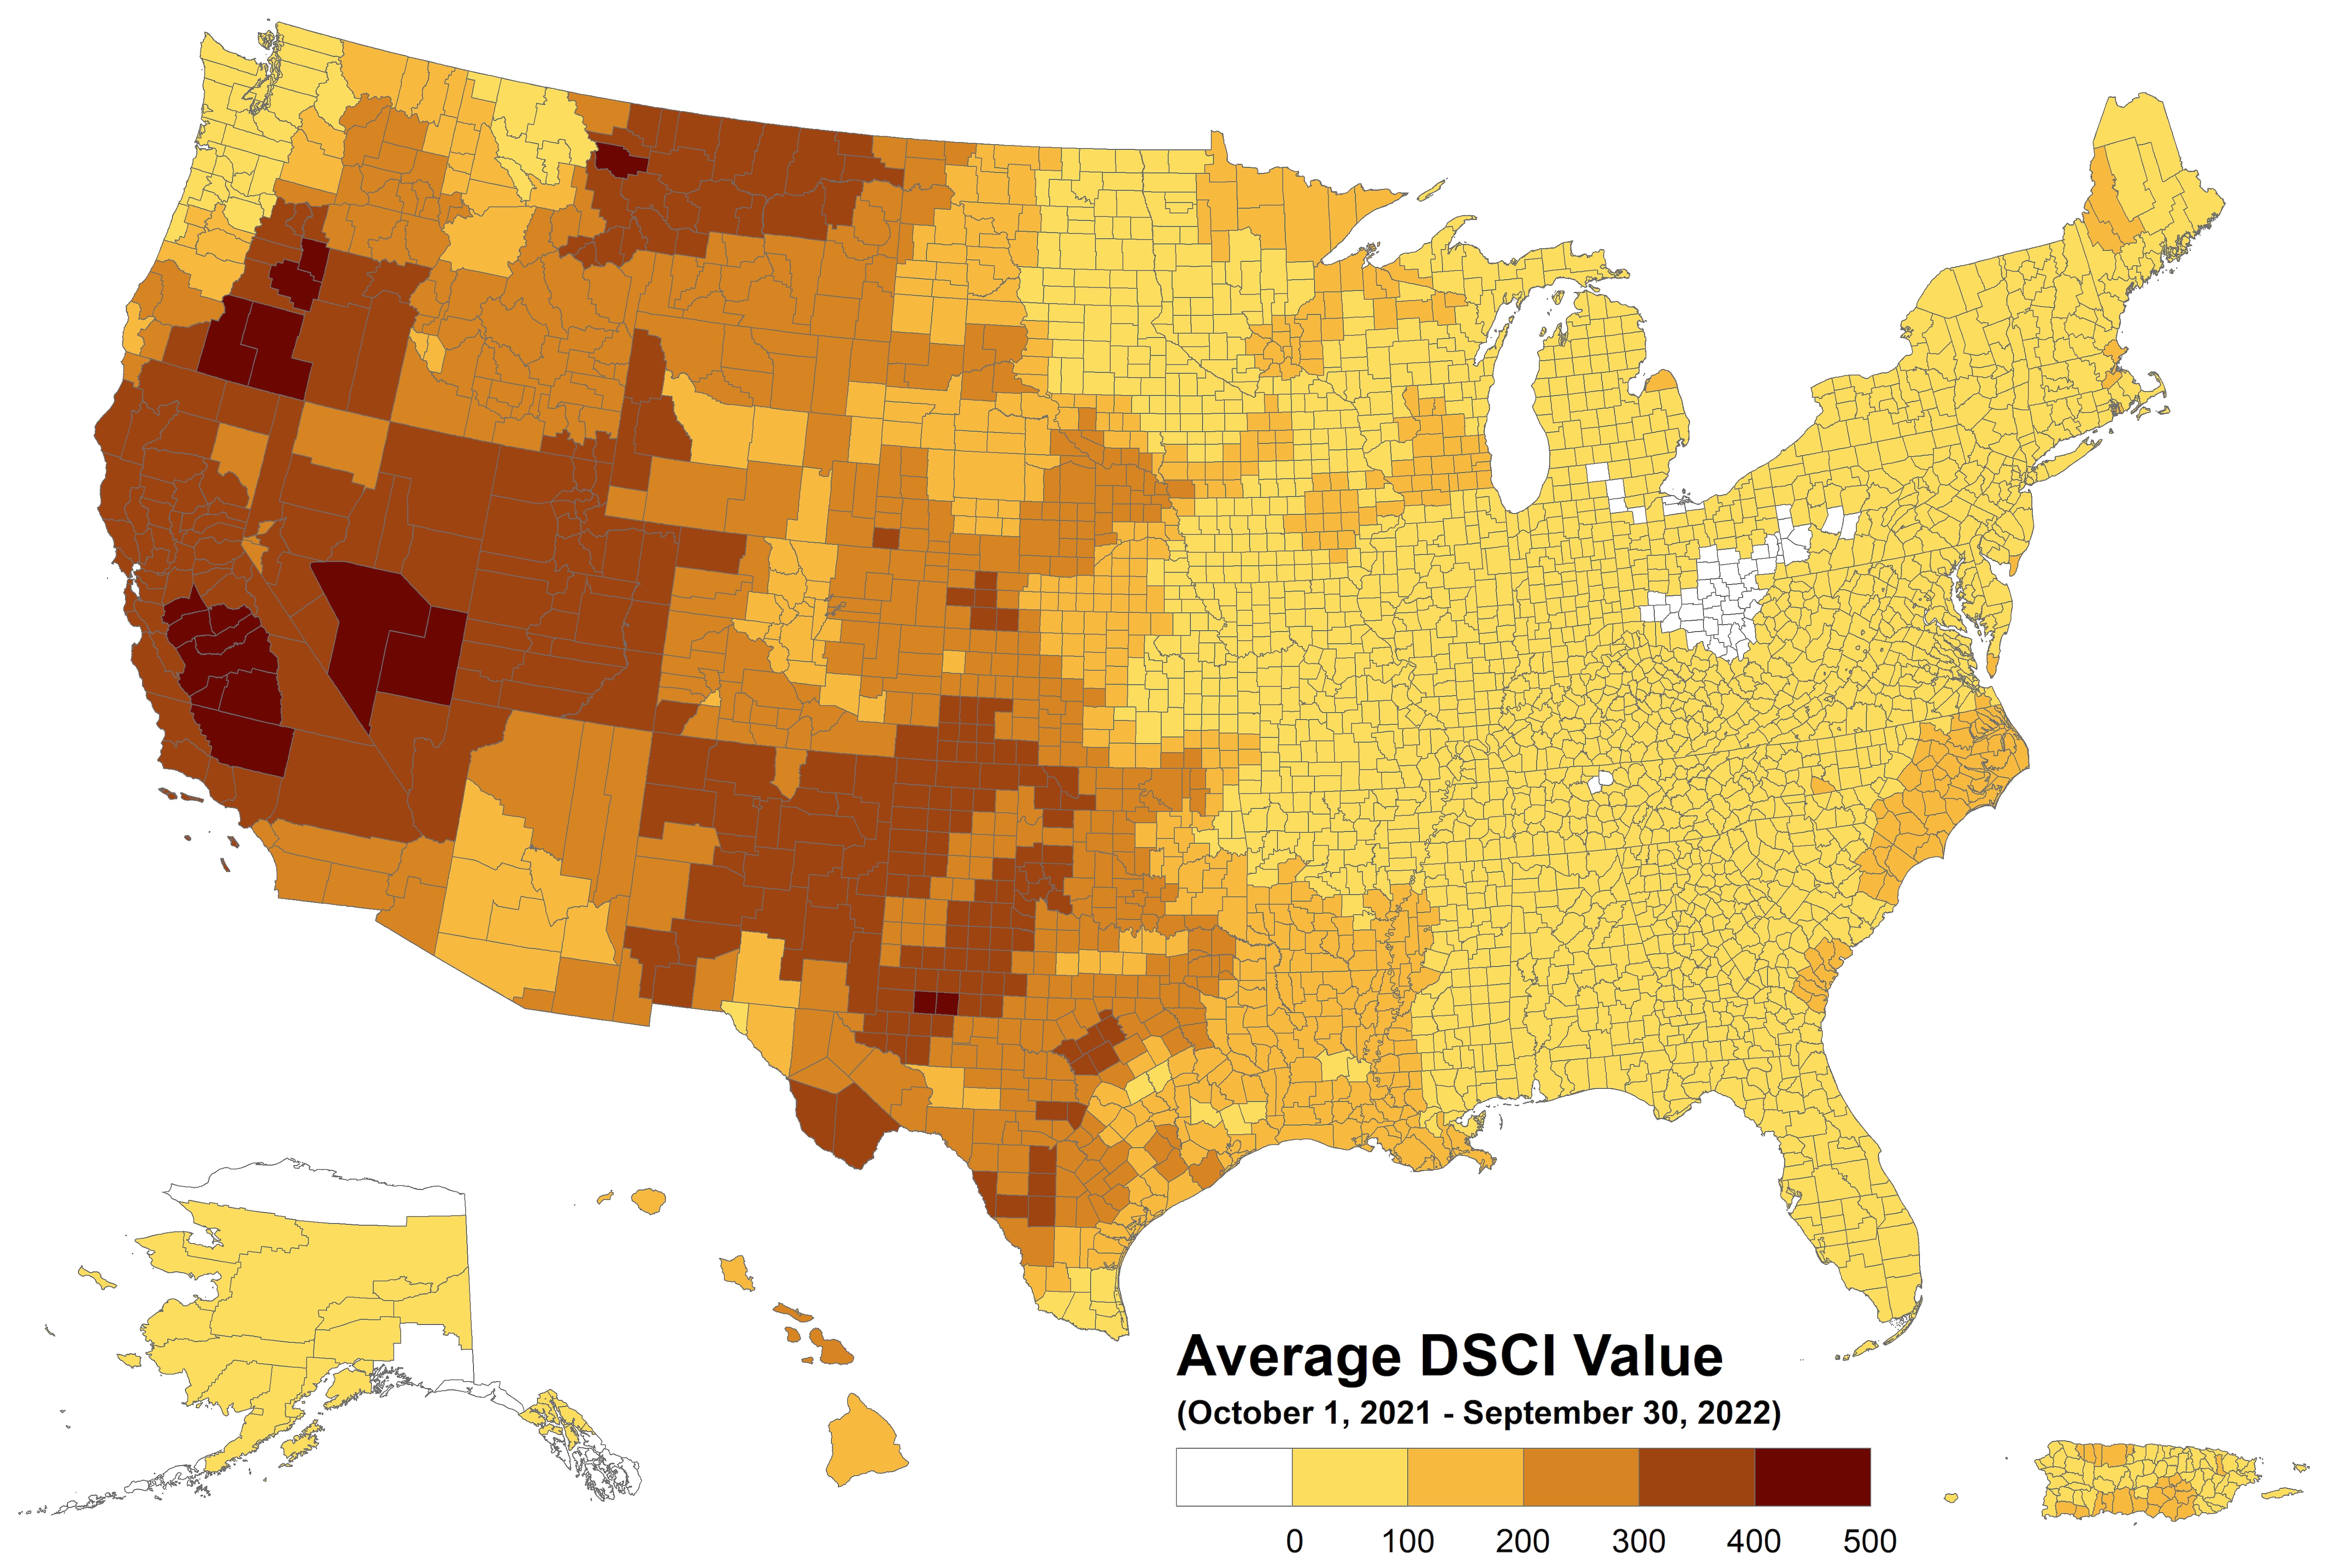
Figure. This map shows the Drought Severity and Coverage Index (DSCI) values for the continuous U.S. from October 1, 2021 - September 30, 2022. The DSCI is an experimental method for converting drought levels from the U.S. Drought Monitor map to a single value for a county.
From October 1, 2021 - September 30, 2022, the majority of the U.S. had some level of abnormal dryness as measured by the DSCI. Possible values of the DSCI are from 0 to 500. Zero means that none of the area is abnormally dry or in drought, and 500 means that all of the area is in D4, exceptional drought. The northwest, southwest, northern great plains, and southern great plains generally had the highest levels of drought. 17 counties had DSCI values in the highest range (>400), meaning they experienced exceptional drought: eight counties in California, four counties in Oregon, two counties in Nevada, two counites in Texas, and one county in Montana. In addition to those states, counties in Oklahoma, New Mexico, and Utah also rank in the top 50 for drought in the past year. Only 61 out of the 3221 counties for which we have measurements had zero dryness or drought. You can explore the full list of counties here.