
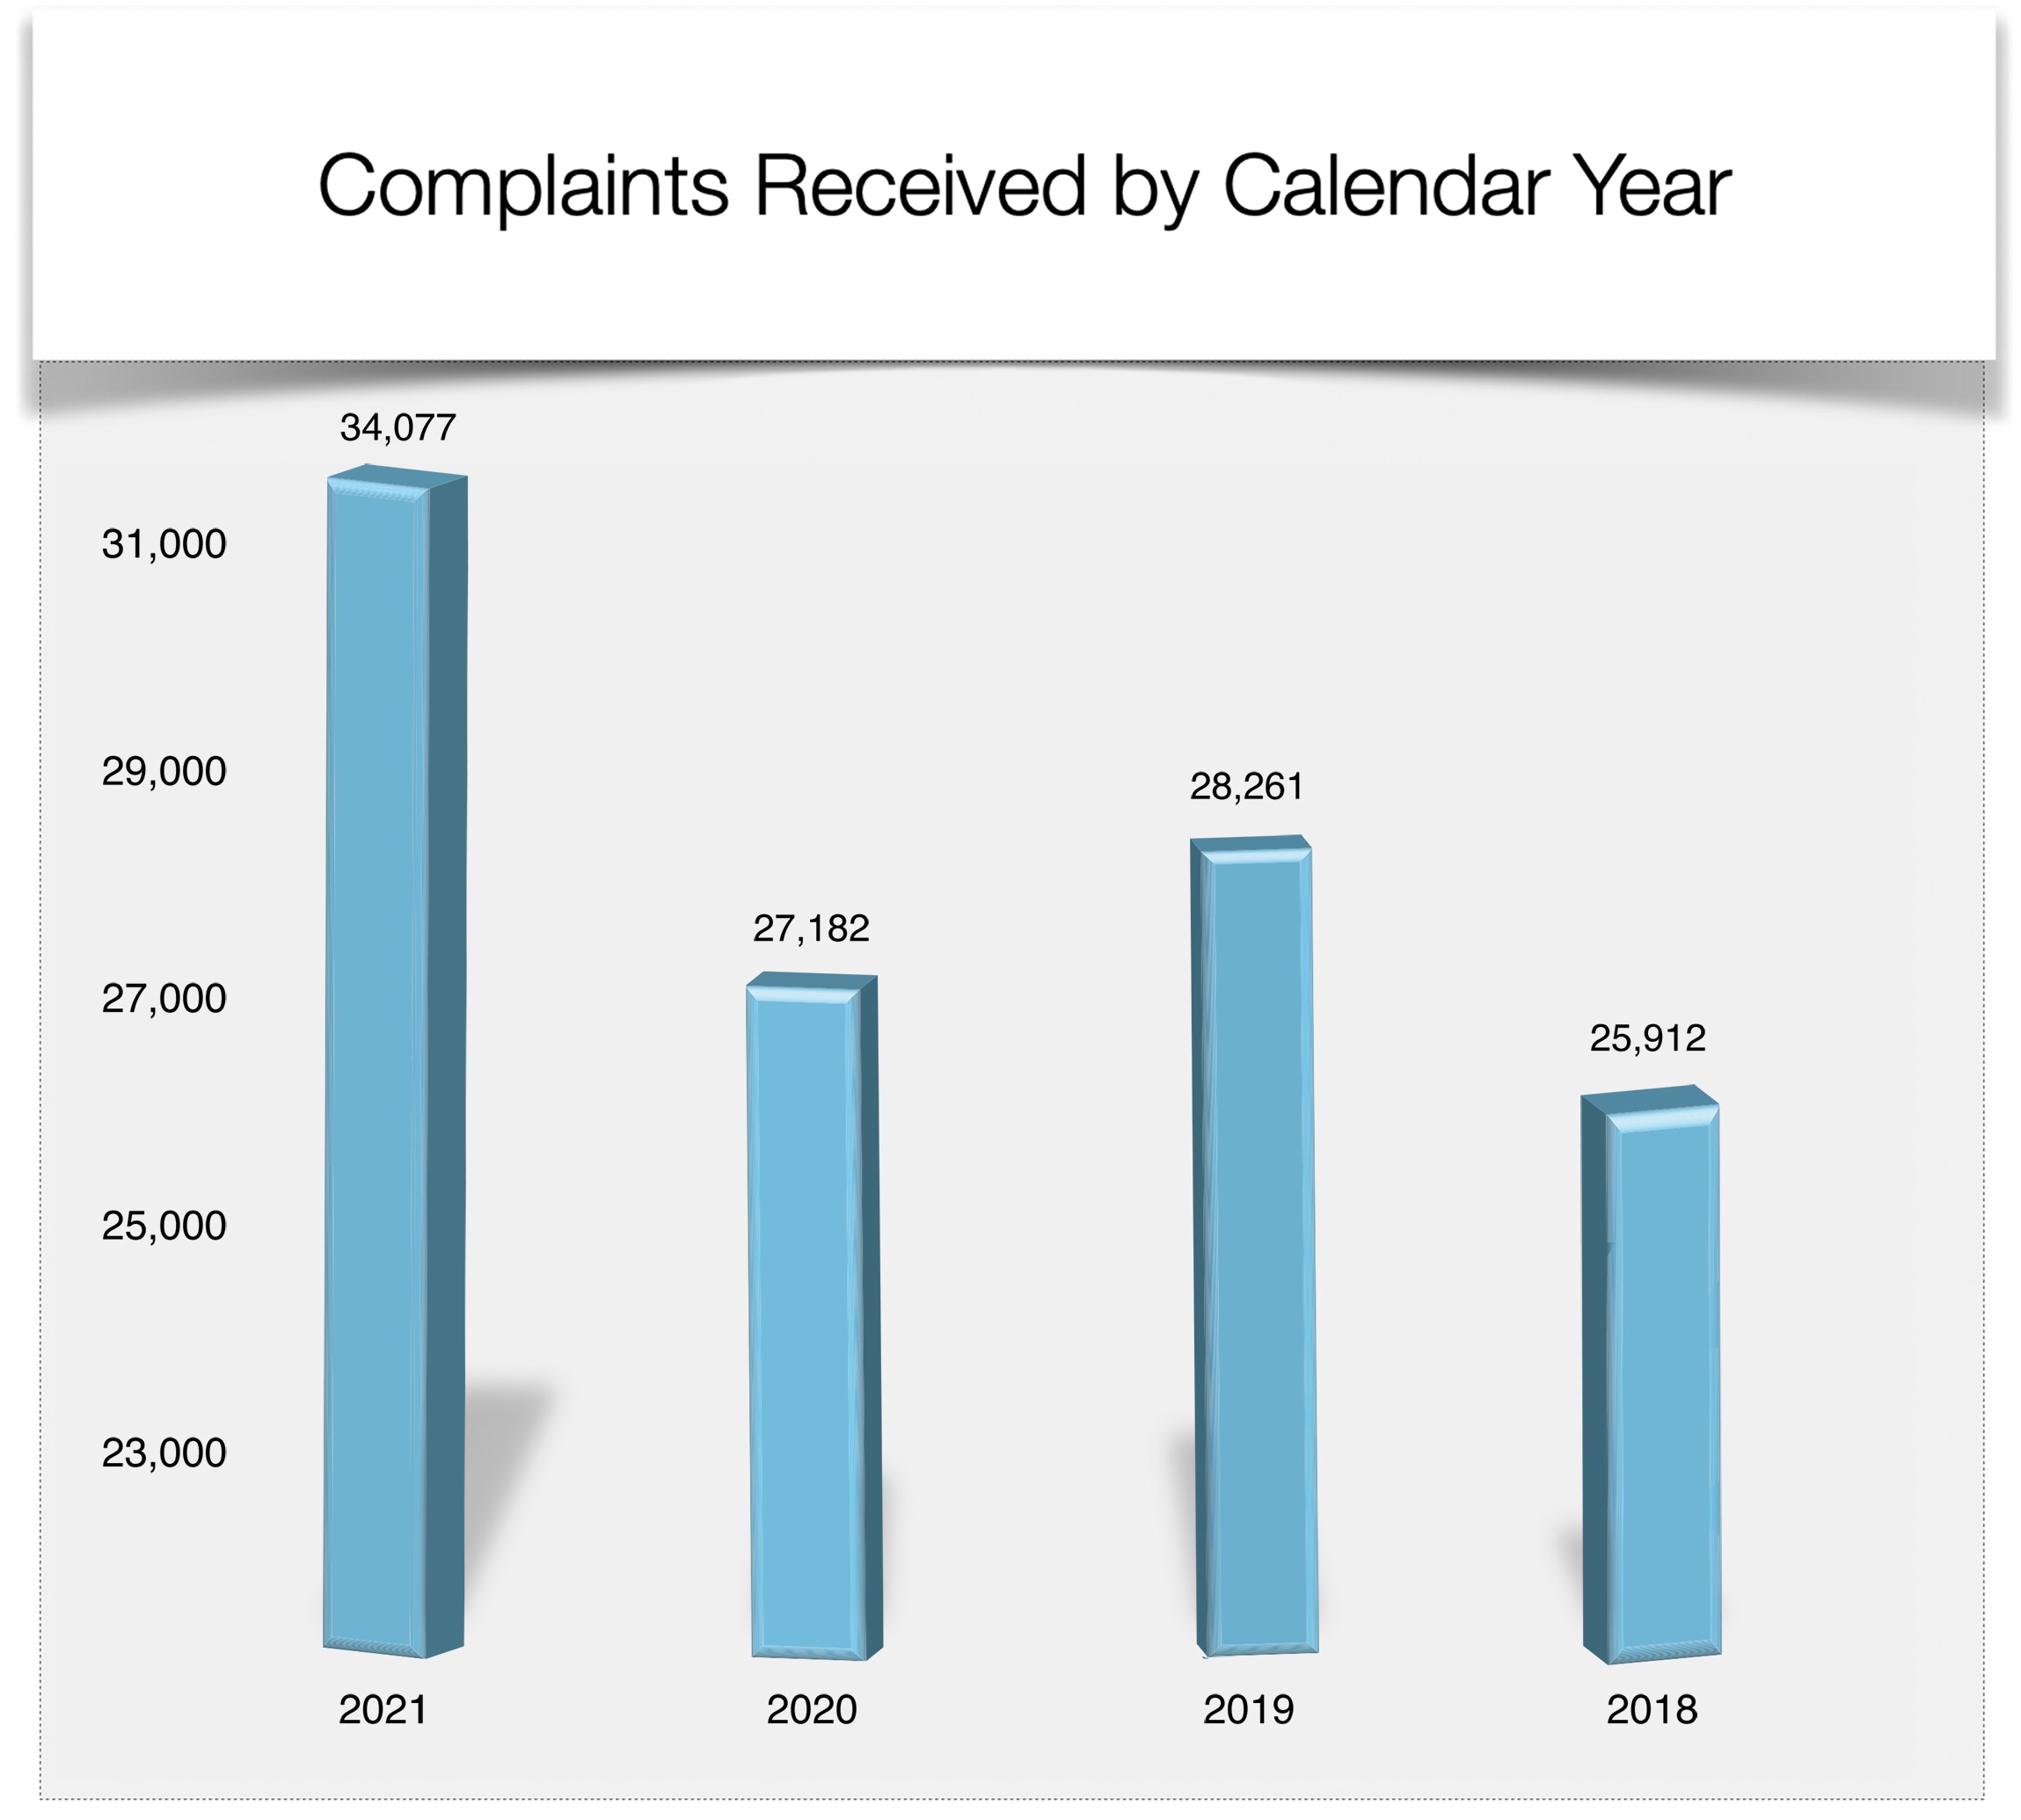
This bar graph represents annual numbers of complaints received since for calendar years 2018 through 2021.
| YEAR | COMPLAINTS RECEIVED |
|---|---|
| 2021 | 34,077 |
| 2020 | 27,182 |
| 2019 | 28,261 |
| 2018 | 25,912 |
Image
This bar graph represents annual numbers of complaints received since for calendar years 2018 through 2021.
| YEAR | COMPLAINTS RECEIVED |
|---|---|
| 2021 | 34,077 |
| 2020 | 27,182 |
| 2019 | 28,261 |
| 2018 | 25,912 |


